`BlockedRun` is only named inside types.ts, by CompleteResult. The repo's
knip gate rejects unused exports, so drop the export keyword rather than
add a knip.json exception — nothing outside this file needs the name yet.
The RunBlockEdge comment pointed at stale waitpointSystem.ts line
numbers that no longer match the file after this branch shrank it.
Name the continueRunIfUnblocked method instead so the citation can't
drift again.
## Summary
Adds a second generation of run-ops id, plus the resolver that reads a
store key straight out of an id. A gen-2 id keeps the existing
26-character layout, but the character at index 24 becomes a routing
shard key instead of a region code, and the version character at index
25 becomes `"2"`. Nothing mints gen-2 ids yet, so this is inert on
merge.
## Design
The version character is a single character, so the gen-1 and gen-2
shape checks can never both match. That is what makes the two
generations provably disjoint rather than disjoint by convention.
```ts
resolveShard(id) // gen-2 body -> its shard key, [a-z0-9]
// gen-1 v1 body -> "new"
// anything else -> "legacy"
```
`resolveShard` is total: it returns a key for any input string,
including an empty or malformed one, and never throws.
`classifyResidency` keeps its signature and its two values, and now
reports gen-2 ids as part of the dedicated family, so existing consumers
of that boolean are unaffected.
The body stays 26 characters rather than 27 deliberately. The older
27-character format is still in the wild and has to keep resolving to
legacy, and a longer gen-2 shape would need probabilistic disambiguation
against it. A rare misroute is not an acceptable property for a routing
key.
The one behavior change is that a 26-character body ending in `"2"` now
routes by its shard key instead of falling back to legacy. Two test
assertions pinned the old result and are updated here. A repository-wide
search confirms they are the only two of their kind.
Verified against the full run-store corpus (68 files, 370 tests) with no
test-file changes there, plus the run-engine residency and waitpoint
suites. No changeset: the new surface has no caller, so a version bump
would tell a user nothing.
Cuts CPU on the `engine/v1/worker-actions/*` routes a managed supervisor
calls, and adds the benchmark harness the numbers come from.
Measured on a local stack: **on-CPU per completed run 9.07ms → 6.59ms
(−27%)**, busy fraction 45.6% → 33.8%, with every worker-action p50 down
23–27%. Load was 5,000 runs / 24 virtual supervisors / 90s window /
30,120 requests / 0 errors.
Query-count work from the same investigation is deliberately **not**
here — it will follow as a separate PR.
## The three changes
**1. Split the event-loop monitor in two (~14% of on-CPU, plus ~5pp of
GC).**
`eventLoopMonitor.server.ts` installs a global `async_hooks` hook:
`init` writes a `Map` entry for *every* async resource the process
creates, `before` calls `process.hrtime()` and `context.active()` on
every one. Enabling any async hook also puts V8 on the slow path for
promise instrumentation process-wide. `EVENT_LOOP_MONITOR_ENABLED`
defaulted to `"1"`, so this was the shipping configuration.
The blocked-loop detector is now opt-in (`EVENT_LOOP_MONITOR_ENABLED`,
default `0`). The event-loop *utilization* gauge — a single interval
timer with no per-request cost — moves to its own flag
(`EVENT_LOOP_UTILIZATION_MONITOR_ENABLED`, default `1`) and stays on, so
the useful half survives without the expensive half.
A/B under identical load:
| | monitor on | monitor off | change |
|---|---|---|---|
| on-CPU per run | 9.08ms | 7.25ms | −20% |
| GC self time | 9.80% | 5.05% | −4.75pp |
| dequeue p50 | 76.6ms | 62.8ms | −18% |
| attempts/start p50 | 56.3ms | 43.5ms | −23% |
**2. Bucket route matching by first static path segment (10.4% → 3.9% of
on-CPU).**
`patches/@remix-run__router@1.23.3.patch` already memoized flattened
branches and compiled path regexes. What remained was the linear scan:
`matchRouteBranch` walked the ranked branch list calling `matchPath` per
branch across 521 route files, so every worker-action request paid a
scan proportional to the whole route table.
Branches are now indexed by their lowercased leading segment, with one
always-considered list for branches whose leading segment is dynamic,
splat or optional (and for root/pathless paths). A request walks only
its own bucket merged with that list. Route-matching self time dropped
64% (3.6s → 1.3s over a 90s window).
Ordering is preserved exactly: both lists hold indexes into the already
rank-sorted branch array and are walked in ascending-index order, so the
first match found is the same branch the full scan would have found.
Bucketing lowercases on both sides, so case-insensitive matching still
resolves and `caseSensitive: true` routes are still rejected by
`matchPath` itself. A pathname whose own leading segment can't be
bucketed falls back to the full scan.
Verified equivalent to the unpatched matcher over 20,050 pathnames
(literal, dynamic, splat, optional, case variants, basenames,
percent-encoded) with zero mismatches.
`apps/webapp/test/routeMatchingPatch.test.ts` pins the matching
semantics rather than the optimisation, so it still passes without the
patch.
**3. Demote per-heartbeat and per-dequeue `info` logs to `debug`.**
These are the two highest-rate engine calls and each wrote a synchronous
structured log line on every request. Synchronous `console` writes can
block the loop when stdout backs up, which costs more than the ~1.3% CPU
share suggests.
## The harness
Two benchmarks, neither in the default suite (they run for minutes,
attach the V8 profiler, and report numbers rather than assert on them).
See `apps/webapp/test/bench/README.md`.
- `apps/webapp/test/bench/engineHttp.bench.test.ts` — spawns a real
webapp against throwaway Postgres/Redis containers, seeds a production
environment with a promoted managed deployment, and drives a closed-loop
supervisor pool through the full lifecycle. Profiling runs over CDP
rather than `--cpu-prof` so it covers only the measured window instead
of being swamped by boot, and `performance.eventLoopUtilization()` is
sampled *inside* the webapp process.
-
`internal-packages/run-engine/src/engine/bench/runEngineLifecycle.bench.test.ts`
— drives `RunEngine` directly, profiling enqueue and lifecycle
separately so engine cost isn't mixed with request-stack overhead.
- `apps/webapp/test/bench/analyzeProfile.ts` — dependency-free
`.cpuprofile` analyzer that symbolicates through the build's source maps
and ranks CPU by package, self time and total time. Percentages are
shares of on-CPU time (V8's `(idle)`/`(program)` excluded).
`startWebapp` gains `overrideEnv`, applied after the worker-disable
defaults, so the HTTP bench can re-enable the run engine worker that
drains the master queue into the worker queues a supervisor dequeues
from.
The local OTel collector gains a traces pipeline. It only defined a
metrics pipeline, so pointing `INTERNAL_OTEL_TRACE_EXPORTER_URL` at it
locally failed and the webapp silently fell back to the console span
logger.
## Configuration
For operators upgrading:
- `EVENT_LOOP_MONITOR_ENABLED` (now defaults to `0`) — the
per-async-resource blocked-loop detector. Set to `1` to restore the
previous behaviour and keep emitting `event-loop-blocked` spans.
- `EVENT_LOOP_UTILIZATION_MONITOR_ENABLED` (new, defaults to `1`) — the
`nodejs.event_loop.utilization` gauge. Unchanged in behaviour; it just
has its own flag now so it survives turning the detector off.
## Notes for review
- `pnpm-lock.yaml` changes only because the router patch content
changed, which changes its patch hash.
- One thing the profile ruled out: with a real OTLP collector receiving
spans, tracing costs ~1.7% of on-CPU at 100% sampling and ~0.8% at the
production rate. Span shipping is not a hidden cost, so nothing here
touches it.
- Caveats on the numbers: a laptop, not production hardware, so DB and
Redis *latency* are unrepresentative (client-side CPU is what's ranked);
single webapp process; throughput varies ~5% run to run, which is why
the claims rest on on-CPU per run rather than req/s.
## Verification
- 20,050-pathname router equivalence check vs the unpatched matcher,
zero mismatches
- `apps/webapp/test/routeMatchingPatch.test.ts` (12 cases) passes
- webapp e2e smoke suite (68 tests) passes through the patched router
- run-engine suites covering the snapshot/attempt paths pass
- `typecheck`, `format`, `lint`, `knip` clean
Two small tweaks to the `Switch` primitive, so every variant and call
site picks them up:
1. **Track is 2px shorter.** `large` 44 → 42px, `medium` 32 → 30px,
`small` 24 → 22px. The checked thumb travel drops by the same 2px so the
thumb stays flush at both ends.
2. **Holding the switch down stretches the thumb into an oval** pointing
the way it's about to travel — rightwards when off, leftwards when on.
Pure CSS via `group-active:`, no new state or handlers.
The thumb's `transition` shorthand doesn't cover `width`, so it's now
`transition-[translate,width,background-color]` (same 150ms
duration/easing as before). `size-N` on the thumb became `h-N w-N` so
the press rule overrides the same `width` utility.
Verified in headless Chrome across all five variants in both states:
correct widths at rest, thumb flush at both ends, stretch grows the
right direction, and no overflow of the track.
<img width="266" height="108" alt="CleanShot 2026-08-21 at 10 16 14"
src="https://github.com/user-attachments/assets/ee95a399-0a40-48c4-a325-a1166b3bd88a"
/>
🤖 Generated with [Claude Code](https://claude.com/claude-code)
<!-- conductor-workspace-link -->
---
[Open workspace in
Conductor](https://app.conductor.build/workspace/c1ce8d0f-9ed2-4fbc-8084-a3989484cc53)
---------
Co-authored-by: Claude Opus 5 (1M context) <noreply@anthropic.com>
## Summary
The platform notifications admin page can now save a notification as a
draft without committing to a schedule, then publish it later by
entering start and end dates. Drafts stay hidden from the webapp panel,
the CLI, and the "What's new" changelog until they are published.
## Design
A draft is an `isDraft` flag on `PlatformNotification`, not nullable
dates, so the existing index and every read query stay intact. All three
reader queries filter on the flag, so a draft can never surface
regardless of its placeholder dates. Publishing writes the real start
and end dates and clears the flag; the publish dialog validates the
range and shows inline errors. Editing a draft keeps it a draft, with
the schedule fields hidden until publish.
Also folds in a small tweak: the "Send preview to me" test button now
appears when editing a notification, not just when creating one.
## Summary
The Queue Metrics dashboard UI is gated by a per-org feature flag, so
there was no way to look at it for a real org without turning it on for
every member of that org. An admin impersonating into an org now sees
the metrics UI there regardless of the flag, so it can be checked
against real data before anyone else in the org sees it.
Nothing changes for a normal session: a member of an org whose flag is
off still gets the classic Queues page, and the gated sub-routes still
404.
## Design
The gate had no request and only resolved the org flag. It now takes the
request and resolves impersonation itself, rather than each caller
computing a boolean and passing it in, so the rule lives in one place
and a new call site cannot forget it. Seven call sites gate on this,
which is exactly why.
Two things narrow the bypass:
- It keys on **impersonation**, not `user.admin`. Impersonation is
scoped to one org and is deliberate; keying on admin status would
silently hand every admin the preview in their own day-to-day orgs.
- It yields to the **view-as-user** toggle. That toggle exists so an
impersonating admin can see what the member sees, and unreleased UI
leaking through it would make it lie. Suppressing a read-only view there
stays inside the display-only contract in `hasAdminDisplayAccess` (added
in #4421).
The bypass also stays behind the gate's existing org-membership lookup.
Since the acting user id is the impersonation target, that lookup is
what keeps the preview confined to the org actually being impersonated
into.
Verified end-to-end against a running instance across the matrix: member
with the flag off gets the classic view and 404s; the same org under
impersonation gets the metrics view and a 200; flipping view-as-user
returns it to the member's exact experience and back; and the flag-on
path is unchanged. An admin who is merely a member, not impersonating,
still gets the classic view.
One thing worth flagging: a few route comments say that with the flag
off no metrics reads fire. That remains true for every member session
and for the org as a whole, but an admin actively previewing does
exercise that org's real Redis and ClickHouse reads. That is inherent to
previewing, and bounded to one admin session.
## Summary
Follow-up to #4738. Splits the dashboard agent's base URL into two: the
instance that hosts the agent project (used for sessions), and the
instance the agent acts against as the user (used by its read-tools).
#4738 only needed the first, but moved the second along with it, which
breaks the tools when the agent runs on a different instance than the
webapp.
## Root cause
The agent's read-tools call the API as the logged-in user via a
delegated user-actor token. The webapp signs that token with its own
`SESSION_SECRET`, scoped to its own `userId` and `environmentId`, so it
can only be verified by, and only resolves the user's data on, that same
instance. #4738 routed the injected `apiOrigin` those tools use to the
agent's host instance, so the token no longer verifies and the data
isn't there.
## Fix
`dashboardAgentApiOrigin()` stays the agent's host instance (sessions,
task triggers, realtime, the `in` forward). A new
`dashboardAgentUserApiOrigin()` returns the webapp's own origin
(`API_ORIGIN ?? APP_ORIGIN`) and is injected into the run metadata the
tools use. Same-instance deployments resolve both to the same host, so
behavior is unchanged there.
## Summary
Lets the dashboard agent point at a specific Trigger instance instead of
assuming it runs on the same instance as the webapp. Adds an optional
`DASHBOARD_AGENT_BASE_URL`; when unset it falls back to the SDK default.
## Root cause
The agent's session start, token mint, head start, in-proxy and the
client transport all built the agent's base URL from the webapp's own
origin (`API_ORIGIN ?? APP_ORIGIN`). That only holds when the agent
project runs on the same instance as the webapp. When it runs elsewhere,
`DASHBOARD_AGENT_SECRET_KEY` belongs to that other instance, so the
webapp's own API rejects it with an "Invalid API key" and the chat can't
start.
## Fix
`dashboardAgentApiOrigin()` now returns `DASHBOARD_AGENT_BASE_URL` or
the SDK default, never the webapp origin. A concrete default (rather
than an unset value) keeps it independent of `TRIGGER_API_URL`, which a
webapp may point at a different host. Every server call site already
routes through that helper; the client transport reads the value from
the root loader via a new `useDashboardAgentBaseUrl` hook.
<!-- ccr-slack-attribution -->
_Requested by **Matt Aitken** · [Slack
thread](https://triggerdotdev.slack.com/archives/C045W9WM3E1/p1786741966214949?thread_ts=1786741966.214949&cid=C045W9WM3E1)_
`idempotencyKeys.reset()` now honours an explicitly passed `scope` even
when the key material happens to be 64 characters long.
**Before:** `resetIdempotencyKey` treated *any* 64-character string as
an already-computed hash and sent it to the API verbatim. That
short-circuit ran before the scope logic, so if your key material is
itself a 64-character digest (a common pattern when you hash your own
dedup identity) the `scope` you passed was silently discarded and the
un-hashed material went on the wire. The server stores the hash, so the
reset matched no run and returned 404 every single time. Key material of
any other length worked fine, which made this look arbitrary.
**After:** a 64-character key with an explicit `scope` is sent verbatim
first and, only when that attempt comes back a definitive not-found,
retried as the derived scope hash. Every call that worked before behaves
identically, and the previously impossible case now resolves on the
fallback.
## How
A 64-character string is forwarded unchanged, exactly as before, when:
- the idempotency key catalog recognises it (it came from
`idempotencyKeys.create()` in this process), or
- no `scope` was passed, so there is nothing to derive a hash from, or
- the scope hash cannot be derived (e.g. `scope: "run"` outside a task
context with no `parentRunId`).
Otherwise the key is ambiguous: it may be raw material the caller wants
hashed with the scope, or it may already be the stored hash. Reset sends
the verbatim value first because that is what every previous version
sent, so anything that resolved before still resolves with the same
single request, the same target run, and the same errors. The derived
hash is the new behaviour, so it only runs once the verbatim attempt has
failed with a 404, a definitive "no run under this key". Any other error
(a 503, a connection error) leaves the verbatim key's state unknown, and
resetting a different key on unknown state would be an untargeted write
the caller never asked for, so those errors surface unchanged. That has
an honest cost: when the endpoint answers 503 for a miss it cannot
confirm, the caller sees the 503 and retries rather than silently
falling through to the derived key. When both attempts miss, the
verbatim attempt's 404 is surfaced, again matching what previous
versions threw.
A side benefit of this order: a key from `idempotencyKeys.create()`
reset with a `scope` from a cold process resolves in a single request,
because the created key is itself the stored value.
`isIdempotencyKey` is deliberately left alone: it applies the same
length rule on the trigger path, but it is self-consistent there, and
changing it would invalidate already-stored keys.
The `attachedOptions?.key` / `attachedOptions?.scope` fallbacks below
the old guard were unreachable (every catalog entry is a 64-character
digest, so it always hit the short-circuit first) and re-deriving from
them produces the identical hash anyway. They are removed rather than
left as dead code.
---
## ✅ Checklist
- [x] I have followed every step in the [contributing
guide](https://github.com/triggerdotdev/trigger.dev/blob/main/CONTRIBUTING.md)
- [x] The PR title follows the convention.
- [x] I ran and tested the code works
---
## Testing
Tests in `packages/core/src/v3/idempotencyKeys.test.ts` drive the real
`resetIdempotencyKey` against a local HTTP server and assert on the
exact values that reach the wire, in order. Nothing is mocked. They
cover:
- 64-character material + explicit `scope` derives the global- and
run-scoped hash once the verbatim key misses (fails without this change)
- the verbatim key wins when runs exist under both the verbatim value
and the derived hash, so the pre-existing target is preserved
- keys from `idempotencyKeys.create()` are forwarded unchanged: catalog
hit, no scope, and scope with a cold catalog (the last now a single
request)
- a transient failure of the verbatim attempt surfaces its error without
ever touching the derived key
- error surfacing: a double miss reports the key the caller passed, and
a non-404 from the fallback is not swallowed
- ordinary short material is still hashed, and underivable run/attempt
scopes still send a 64-character key verbatim while still throwing for
shorter material
```
pnpm run test ./src/v3/idempotencyKeys.test.ts --run # 18 passed
pnpm run build --filter @trigger.dev/core # clean
pnpm run format && pnpm run lint # clean
```
---
## Changelog
`idempotencyKeys.reset()` now works when your idempotency key is itself
64 characters long. Previously any 64-character key was assumed to be
already hashed, so passing one along with a `scope` silently ignored the
scope and the reset never found a matching run.
---
## Follow-ups (not in this PR)
- `docs/idempotency.mdx` describes the `idempotencyKey` parameter of
`reset()` as "the 64-character hash string" in one place while showing
raw material plus `{ scope: "global" }` a few lines later. Worth
reconciling.
- No surface currently exposes the stored hash that the reset endpoint
matches on: `ctx.run.idempotencyKey`, the run page and the
`idempotency_key` query column all show the user-provided key. That is
what leads people to send a value reset cannot match.
---------
Co-authored-by: Claude <noreply@anthropic.com>
Co-authored-by: Matt Aitken <matt@mattaitken.com>
## Summary
Enforces `react/react-compiler` as an error for the webapp now that all
reported compiler diagnostics are fixed or narrowly scoped. Removes the
unused lazy-ref helper made obsolete by the ref initialization cleanup.
## Summary
Scopes React Compiler diagnostics to route statements where refs
intentionally coordinate virtualized views, live reload state, transport
lifecycles, and deferred callbacks. Other compiler diagnostics remain
active in those routes.
## Summary
Scopes React Compiler diagnostics to component and hook statements where
refs intentionally coordinate editors, animations, polling, deferred
callbacks, and other imperative integrations. Other compiler diagnostics
remain active in those components.
## Summary
Replaces render-time ref initialization with lazy state for frozen form
defaults, the tooltip's virtual positioning element, and the side menu's
first-paint visuals. Editable alert fields now update immutable state
snapshots.
## Summary
Scopes React Compiler diagnostics for component and hook effects that
intentionally synchronize with navigation, submissions, browser APIs,
streams, timers, or authoritative server values. Each suppression stays
on the reported synchronization call rather than disabling analysis for
the component.
## Summary
Derives controlled tab, tag, and checkbox values directly during render
instead of copying them through effects. Modal drafts now reset from
their open event, and the route-backed alert dialog renders open
immediately without a mount-time state update.
## Summary
Scopes state synchronization that intentionally resets editable drafts
from authoritative server values, deployment state, or programmatic
filter changes. These values cannot be derived during render without
removing user control between resets.
## Summary
Removes manual memoization where derived values are already rebuilt each
render, narrows the dashboard watch callback to a stable chat
identifier, and scopes two intentional memoization patterns that protect
local edits and serialized synchronization.
## Summary
Makes stable dashboard history refs explicit memo inputs and scopes the
remaining compiler diagnostics to callbacks whose local handlers or
lifetime-stable values cannot be represented accurately in dependency
arrays.
## Summary
Captures chat-history age when the menu opens so rerenders cannot change
labels mid-view. The waitpoint deadline form also reuses one intentional
wall-clock snapshot for all calculations in a render.
## Summary
Records when live metric responses arrive and uses that timestamp to
evaluate gauge freshness and waiting duration. Cached or failed
responses remain untrusted until revalidated, while rendered values stay
stable between polling updates.
## Summary
Derives session and API key expiry states from a timestamp captured by
each route loader. Every status on a page now uses one consistent point
in time instead of changing according to when an individual component
rerenders.
## Summary
Uses explicit bucket timestamps when rendering usage charts instead of
anchoring missing timestamps to the current render time. Tooltips now
remain stable across rerenders, and examples use a deterministic
timestamp.
## Summary
Keeps render inputs and shared regular expressions immutable. Grouped
selects now compute each section's shortcut offset directly from
preceding sections, which also makes numeric shortcuts follow the
displayed item order reliably.
## Summary
Calls dashboard hooks directly instead of passing them as ordinary
callback values, and subscribes to optional Ariakit stores through an
unconditional hook. This keeps hook ordering stable while preserving the
existing behavior when a provider is absent.
## Summary
Adds targeted lint suppressions for components built around libraries
that React Compiler intentionally declines to memoize, plus one
unsupported function-reference pattern. Each suppression is scoped to
the affected component so other compiler diagnostics remain actionable.
## Summary
Enables exhaustive React Hook dependency checking and resolves the
existing violations across the dashboard and React hooks package.
Effects and callbacks now track current values without introducing
request, subscription, or render loops.
## Design
Dependencies are included directly when the hook lifecycle should follow
them. Timers, Remix fetchers, and realtime subscriptions use stable
callbacks or latest-value refs where restarting work would change
behavior.
Unnecessary memoization was removed where ordinary derivation is
clearer. Full lint and typechecks for the webapp and React hooks package
pass.
## Summary
`goose up` against `internal-packages/clickhouse/schema` panics on
`main` today, so ClickHouse migrations cannot be applied from a fresh
checkout. Renumbering the external deployment id migration from 040 to
041 clears it.
## Root cause
Two migrations claim version 40.
[#4615](https://github.com/triggerdotdev/trigger.dev/pull/4615) added
`040_create_task_events_search_v2.sql`, and
[#4661](https://github.com/triggerdotdev/trigger.dev/pull/4661) added
`040_add_task_runs_v2_external_deployment_id.sql` a day later. #4661 was
opened before #4615 merged, so 040 was genuinely free at branch time,
and because the two files have different names there is no textual
conflict for git or a rebase to surface. Both merged green, and no
workflow in this repo runs `goose`, so the collision only shows up the
first time someone actually migrates.
goose parses the numeric filename prefix as the version and refuses
duplicates:
```
panic: goose: duplicate version 40 detected:
.../040_create_task_events_search_v2.sql
.../040_add_task_runs_v2_external_deployment_id.sql
```
It aborts while collecting the directory, before executing any SQL, so
nothing was half applied and there is no migration state to repair.
This migration gets renumbered rather than the `task_events_search_v2`
one because goose keys on the version number and not the filename:
version 40 is already recorded wherever 040 has been applied, so
renaming that file would re-run an applied migration.
Verified with a full `goose up` against ClickHouse 26.2.19.43 (the image
pinned in `internal-packages/testcontainers`): migrations apply cleanly
through version 41, and `task_runs_v2.external_deployment_id` lands as
`String DEFAULT ''`.
## Summary
Speeds up webapp test jobs by balancing measured work across runners,
reducing repeated container setup, and ensuring test workers release
shutdown resources promptly. Unit tests run across 24 duration-aware
shards, while E2E tests run across two balanced shards.
## Design
`RunEngine` shutdown now closes processing resources before support
resources, continues cleanup if one close fails, and reuses one shutdown
promise for concurrent callers. Redis workers clear completed shutdown
deadlines so finished tests no longer wait on idle timers.
Container-heavy suites are split only where it improves parallelism, and
repeated replication and engine fixtures are consolidated where one
end-to-end case provides coverage. Timing weights are refreshed for all
affected files.
Dependency installation overlaps container pulls, and both workflows use
WarpBuild's Node setup action.
<!-- ccr-slack-attribution -->
_Requested by **Iss** · [Slack
thread](https://triggerdotdev.slack.com/archives/C045W9WM3E1/p1787161814493949)_
**Before:** archiving a branch dropped the query string on the way back
to the branches list, so the list reset to page 1. Working down a long
list meant re-navigating to the page you were on after every archive.
**After:** you land back on the exact page you archived from, with
`page`, `search` and `showArchived` intact.
The archive action now redirects to the page the request came from
instead of rebuilding a bare branches path.
## How
The archive dialog already submits the page it was opened from as a
hidden `redirectPath` field (`${location.pathname}${location.search}`),
and the failure path already redirected to it — only the success path
ignored it and rebuilt the path with `branchesPath`/`branchesDevPath`,
which have no query string. Both paths now redirect to the submitted
path, run through the existing `sanitizeRedirectPath` helper to keep the
redirect same-origin (the same idiom used by
`resources.batches.$batchId.check-completion`).
## ✅ Checklist
- [x] I have followed every step in the [contributing
guide](https://github.com/triggerdotdev/trigger.dev/blob/main/CONTRIBUTING.md)
- [x] The PR title follows the convention.
- [x] I ran and tested the code works
---
## Testing
Three files change:
- `apps/webapp/app/routes/resources.branches.archive.tsx` — the fix.
- `apps/webapp/test/archiveBranchRedirect.test.ts` — new test that
drives the archive action and asserts the redirect `Location`: the query
string survives on both success and failure, and an off-origin
`redirectPath` falls back to `/`. Reverting the fix makes two of the
three cases fail, so the test covers the regression.
- `.server-changes/archive-branch-keeps-list-page.md` — release-note
entry, since this is a user-facing server-only change.
Also ran `pnpm run typecheck` and `oxlint` for `apps/webapp` — both
clean.
---
## Changelog
Archiving a branch now returns you to the same page of the branches list
instead of resetting it to page 1.
---
## Screenshots
_None — no visual change._
---------
Co-authored-by: Claude <noreply@anthropic.com>
## Problem
Every merge to main touching the agent queued a gated `staging`+`prod`
deploy that sat `pending` on a reviewer approval nobody grants
routinely. Because the gated runs never completed, they never drained
the concurrency queue and cancelled each other, so the Actions tab
filled with never-completing runs and the agent only ever actually
deployed via a manual dispatch + approval.
The reviewer gate bought nothing here: the agent deploys with
`--skip-promotion`, so a deploy lands **dormant** and nothing goes live
until the consuming webapp flips `DASHBOARD_AGENT_VERSION`. Promotion is
already a deliberate act (the env-var flip); gating the dormant deploy
on top of that just created the pile-up.
## Change
- **Remove the reviewer gate** by dropping the required-reviewers rule
on the `dashboard-agent-*` environments (repo-settings change, done).
The `environment:` key **stays** so the per-environment scoped deploy
token still resolves — no secret migration.
- **`workflow_dispatch` `ref` input** — deploy a specific commit SHA,
branch, or tag; defaults to the ref the run launches from. Checkout uses
`github.event.inputs.ref || github.sha`.
- **Require the ref to be an ancestor of `main`.** Constrains which
commit gets deployed to merged code only. A push is always main's tip
(passes trivially); a dispatched unmerged ref is rejected before the
deploy step. Because an explicit `ref:` checkout doesn't create
remote-tracking branches, `origin/main` is fetched explicitly before
`git merge-base --is-ancestor`.
- **`cancel-in-progress: false`** (kept). Cancelling the runner wouldn't
stop the remote build (it finishes server-side), and a superseding
concurrent deploy would race the same project's indexer. With the gate
gone, deploys are short, so a brief queue can't pile up.
- `max-parallel: 1` stays (parallel deploys of the same project race at
the indexer).
## Owner actions (repo settings — not in the diff)
1. **Remove required-reviewers** on `dashboard-agent-staging` and
`dashboard-agent-prod` — done.
2. **Add a deployment branch policy** on both environments restricting
deployments to `main`. This is the authoritative token guard:
`workflow_dispatch` runs the workflow file from the selected ref, so the
in-file ancestor check alone can't protect `TRIGGER_ACCESS_TOKEN` (a
branch could edit the check out). GitHub enforces the branch policy
server-side against `GITHUB_REF` regardless of file contents. With it in
place, the workflow only runs (and the token is only exposed) when
dispatched from `main`, and the in-file check then constrains the
independent `ref` input to merged commits.
## Pile-up root cause
The stacking was caused by the **reviewer gate** (runs waited forever,
so the queue never drained), not by `cancel-in-progress`. Removing the
gate is what fixes it; `cancel-in-progress` stays `false`.
Two defects that surface when a run parked on an external deployment id
gets pushed by a debounce key. Both were reproduced against a local
instance before being fixed.
## 1. The run is expired before it is due
```
now | status | statusReason | delayUntil | expiredAt
13:57:06 | EXPIRED | EXTERNAL_DEPLOYMENT_NOT_FOUND | 14:01:37 | 13:57:02
```
Killed 4m35s before its own scheduled start, blaming a missing
deployment.
**Why.** The park deadline is armed **once**, when the run is first
parked, from `max(now, delayUntil) + deadline`. Debounce pushes
`delayUntil` out afterwards and nothing re-arms it:
- `rescheduleDelayedRun` reschedules `enqueueDelayedRun:<id>`, not
`expireParkedExternalDeploymentRun:<id>`
- the redis-worker reschedule is an update-only `ZADD … XX`, and a
parked run has no `enqueueDelayedRun` job, so that call is a silent
no-op
Repeat triggers on one key walk `delayUntil` away from a deadline that
no longer moves. Once it crosses, the run dies while parked and not yet
due.
**Fix.** The expiry job already loads `delayUntil`, so it re-arms from
the current value and returns instead of expiring a run that is not due.
The guard lives in the expiry job rather than the debounce path
deliberately: it covers **every** caller that moves `delayUntil`, so a
future call site can't reintroduce this by forgetting to re-arm. It
stays bounded by the debounce max-duration contract, so a hot key can't
postpone expiry indefinitely.
## 2. The run reports itself as delayed while it is parked
```
RUN_CREATED | PENDING_VERSION | Run is waiting for a deployment of 'debounce-test-2'
DELAYED | DELAYED | Delayed run was rescheduled to a future date ← after one debounce push
```
The row stays `PENDING_VERSION`; the latest snapshot claims `DELAYED`,
so the run page describes a parked run as delayed. Happens on the
*first* push.
**Fix.** `rescheduleRun` hardcoded `DELAYED`/`DELAYED`. The snapshot
statuses are now supplied by the caller and **default to `DELAYED`**, so
the ordinary delayed path is byte-identical, and `rescheduleDelayedRun`
passes the parked statuses through when the run is parked.
## Reproducing
Repeated triggers on one debounce key against an id that hasn't landed:
```bash
curl … -d '{"options":{"externalDeploymentId":"x","debounce":{"key":"k","delay":"5m"}}}'
```
Three triggers correctly fold into one parked run; the defects show up
on the pushes.
## Testing
Two tests, each verified red before green and failing alone:
- a run whose delay was pushed past the deadline stays `PENDING_VERSION`
instead of expiring
- a debounce push on a parked run leaves a
`RUN_CREATED`/`PENDING_VERSION` snapshot, not `DELAYED`
`56 passed` across parking, pendingVersion, delayedRunSystem and
debounce; `43 passed` in `PostgresRunStore`. Typecheck, lint, format
clean.
## Notes
- Stacks on #4665, so it lands after the whole external-deployment-id
series.
- No changeset: this fixes unreleased behaviour introduced by the stack
below it, so no user has seen it.
- Both found by Devin's review on #4664, and both confirmed end to end
on a local instance before fixing.
Deployments page: an always-visible External ID column after Deployed
by, and an External ID row in the deployment inspector under Worker
type, both showing an en dash when a deploy carried no id. The Vercel
Linked column now renders before Git, still only when a Vercel
integration is connected. Also corrects the blank-row colSpan, which was
already off by one before this column existed.
Run inspector: an External deployment ID row between Version and SDK
version, read from the run annotations, so an operator can see which id
a run was pinned to - including a run that expired before its deployment
ever arrived, where the locked version is empty but the id is the whole
story. Buffered runs read the id from the same annotations rather than
reporting none.
Long ids are head-truncated with the full value behind the copy button:
a commit SHA is meaningful in its prefix, and the inspector panel can be
narrowed to 250px, where an unbroken 40-character SHA would otherwise
scroll the properties list sideways and push the copy button off-panel
(TRI-12923, TRI-13000).
The SDK discovers an external deployment id at runtime (explicit
TRIGGER_EXTERNAL_DEPLOYMENT_ID always; platform commit-SHA variables and
generic fallbacks when TRIGGER_AUTOMATIC_SKEW_VERSION_PROTECTION=1) and
sends it alongside lockToVersion; the server resolves precedence
(version > external id > current). An id held by a deployed deployment
pins the run to that worker; an in-flight or unknown id parks the run in
PENDING_VERSION with the id in TaskRun.annotations, wakes it pinned when
a deployment carrying the id finalizes (ClickHouse candidates, Postgres
authoritative), and expires it after a deadline that re-checks Postgres
before acting. Parking outranks delaying and preserves delayUntil. The
id is projected to ClickHouse task_runs_v2.external_deployment_id during
replication. Redis cache for id-to-worker resolution, guarded
version-aware writes.
Ids are not unique. Several deployments can hold one id - a --force
rebuild is the ordinary way to get there - so resolution always picks
the highest version among the candidates, never the newest by timestamp.
The rule is applied identically on both paths that can bind a run to a
worker: resolveExternalDeployment at trigger time, and
PendingVersionSystem when a landing deployment wakes a parked run.
Version comparison is numeric on the counter half, so 20260807.10
outranks 20260807.9.
A run whose id never lands expires at the deadline with
EXTERNAL_DEPLOYMENT_NOT_FOUND and an error naming the id it waited for,
which is what a failed build or a typo looks like from the caller.
Default deadline is one hour (EXTERNAL_DEPLOYMENT_PARK_DEADLINE_MS).
Debounce registration happens in both the parked and the delayed branch
through one helper, so a debounced run that parks still binds its
debounce key; without it every later trigger for the same key created
another parked run, and all of them executed when the deployment landed.
The two DELAYED-only status checks in DebounceSystem also accept
PENDING_VERSION, without which the lock-contention fallback would
rethrow a 5xx the SDK retries and amplifies, and the fast path would
push every trigger on a parked key through the redlock.
Resolution is skipped in development. A dev environment cannot hold a
WorkerDeployment - trigger dev registers a BackgroundWorker with nothing
behind it, and deploy --env refuses dev - so an external deployment id
there could only ever park, and the parked run then expired against the
dev TTL while a connected dev worker sat idle. The id is still annotated
so the dashboard shows what the app sent (TRI-13000).
A deploy can carry an opaque external id (commit SHA, CI run id, release
tag). Repeating an id that already deployed returns the existing version
as a no-op instead of rebuilding; an id with a build in flight is
rejected with 409 naming that version; a failed id rebuilds freely.
--force is non-destructive to deployments that already succeeded - both
persist and the higher version wins - but cancels a build still in
flight, so one id never has two live builds racing to define it.
Cancelling writes a terminal status and appends a finalized event, which
aborts a build the platform drives; a build it does not drive keeps
running but can never land, and the CLI says so. Ids are deliberately
not unique - reuse is resolved in application code by highest version,
never timestamps. The no-op path mints no build credentials and no event
stream (TRI-12923).
What that means for callers: a --force rebuild leaves two deployments
holding one id, and runs triggered with it go to the higher version once
the rebuild lands, so the takeover needs no separate promotion. Until a
successful build exists for an id, runs triggered with it park and then
expire rather than falling back to current - a failed build is therefore
visible to the caller as expired runs, not as runs on the wrong release.
An external deployment id is an opaque, caller-chosen name for a release
- a commit SHA, a CI run id, a release tag. This adds the shared
contract that both halves of the feature read, and nothing else: no
deploy writes one yet and no trigger sends one.
ExternalDeploymentId is defined once and reused by
InitializeDeploymentRequestBody.externalId and
TriggerTaskRequestBody.options.externalDeploymentId, so a value accepted
by one half can never be rejected by the other. A value that is blank
once trimmed is treated as absent rather than rejected, so an unset CI
variable expanding to an empty string is not a 400. The 128 character
limit fits a SHA-256 commit hash with room for composite ids, and
EXTERNAL_DEPLOYMENT_ID_MAX_LENGTH is the single source of truth that the
request schemas and the CLI both read.
RunAnnotations.externalDeploymentId records the request, not the
outcome: lockedToVersionId and taskVersion are overwritten when a run
locks, whereas this stays true forever, and it can carry the pin for a
run parked before its deployment exists.
Also lands the runtime discovery helpers as pure functions over an
environment reader: the explicit TRIGGER_EXTERNAL_DEPLOYMENT_ID
variable, the platform and CI commit-SHA table, and the
TRIGGER_AUTOMATIC_SKEW_VERSION_PROTECTION gate. Nothing calls them yet.
refs TRI-13000
Migrations only, no code reads them yet. Postgres: nullable non-unique
externalId on WorkerDeployment plus a CONCURRENTLY-built (environmentId,
externalId) index in its own migration file. ClickHouse:
external_deployment_id String DEFAULT '' on task_runs_v2 (plain String,
not LowCardinality - commit SHAs are high-cardinality). Part of task run
version skew protection (TRI-12998).
## Summary
Move tree selection onto semantic tree items and use native expansion
buttons.
Dashboard and story tree rows now share mouse and keyboard selection
through `getNodeProps`. Expand and collapse affordances are named
buttons instead of clickable layout elements.
Base: [#4700](https://github.com/triggerdotdev/trigger.dev/pull/4700)
## Summary
Use native controls for sortable columns and selectable prompt versions.
Table headers keep filter actions separate from sort buttons, prompt
version rows expose pressed state, and a redundant deployment click
interceptor is removed.
Base: [#4699](https://github.com/triggerdotdev/trigger.dev/pull/4699)
## Summary
Make time-filter mode selection keyboard accessible.
Duration and exact-range modes now use native pressed buttons. Nested
date, duration, and quick-select controls no longer depend on click
propagation blockers.
Base: [#4698](https://github.com/triggerdotdev/trigger.dev/pull/4698)
## Summary
Replace mouse-only dashboard actions with native buttons.
Copy, remove, and stop-generation controls now expose keyboard focus and
accessible names. Hover-revealed actions remain mounted so keyboard
users can discover them, and a decorative clipboard icon no longer
captures clicks.
Base: [#4697](https://github.com/triggerdotdev/trigger.dev/pull/4697)
## Summary
Use native label and checkbox behavior for `CheckboxWithLabel` and
enforce `jsx-a11y/no-noninteractive-element-interactions`.
The component no longer simulates checkbox activation with click
handlers on non-interactive wrappers. Native change events now drive the
controlled checked state.
Base: [#4696](https://github.com/triggerdotdev/trigger.dev/pull/4696)
## Summary
Require accessible names for dashboard controls.
Filter menu action items and chart color controls now expose explicit
names. The chart legend action uses a native button, while lint depth
and spacer-cell configuration match the rendered control structure.
Base: [#4695](https://github.com/triggerdotdev/trigger.dev/pull/4695)
## Summary
Finish associating dashboard form labels with their controls and enforce
`jsx-a11y/label-has-associated-control`.
Repeated data store dialogs use unique generated IDs, story controls and
notification filters have explicit associations, and display-only status
text no longer uses label elements.
Base: [#4694](https://github.com/triggerdotdev/trigger.dev/pull/4694)
## Summary
Associate internal model administration labels with their form controls.
The model editor, creator, and tester now use explicit `htmlFor` and
`id` pairs. Section titles that do not label controls now use headings
instead of label elements.
Base: [#4693](https://github.com/triggerdotdev/trigger.dev/pull/4693)
## Summary
Enable foundational JSX accessibility checks for image text alternatives
and valid ARIA roles.
The avatar color picker now has an explicit accessible name and
decorative image alternative. Dashboard chat styling props no longer
reuse the reserved DOM `role` name.
Base: [#4692](https://github.com/triggerdotdev/trigger.dev/pull/4692)
## Summary
Add explicit types to native dashboard buttons and enforce
`react/button-has-type`.
This prevents action buttons from accidentally submitting a surrounding
form. Shared button primitives retain their caller-selected submit and
reset semantics with documented lint exceptions.
Base: [#4691](https://github.com/triggerdotdev/trigger.dev/pull/4691)
## Summary
Remove redundant React fragments from the dashboard and enforce
`react/jsx-no-useless-fragment`.
The cleanup returns existing nodes, arrays, and empty states directly
without adding wrapper elements.
Base: [#4689](https://github.com/triggerdotdev/trigger.dev/pull/4689)
## Summary
Keep component and renderer identities stable across dashboard renders.
Inline icon components, chart renderers, table cells, and select render
callbacks now use module-level implementations. Oxlint enforces the
pattern across the dashboard.
Base: [#4688](https://github.com/triggerdotdev/trigger.dev/pull/4688)
## Summary
Enforce stable React hook ordering in the dashboard and React hooks
package.
Conditional hook calls now keep a consistent order, and overloaded
realtime stream arguments are resolved before entering the shared hook
implementation.
Base: `main`
`@grpc/grpc-js` sat at 1.12.6 in the lockfile. `dockerode` is the only
consumer and already declares `^1.11.1`, so a scoped override is enough:
```json
"@grpc/grpc-js@>=1.12.0 <1.12.7": "1.12.7"
```
Pinned exactly to stay on the 1.12 line; a caret would pull 1.14.x.
## Summary
Listing schedules could block the event loop for seconds. A page of 100
timezone-aware schedules spent over two seconds on cron arithmetic
alone, after the database work was already done, which stalls every
other request on that process. The same page now resolves in tens of
milliseconds.
## Root cause and fix
`cron-parser` walks the calendar unit by unit, and under a named
timezone every step goes through luxon. Parsing an expression is cheap
(single-digit microseconds); *stepping* it is not, ranging from a couple
of hundred microseconds for a common expression to several milliseconds
for a sparse one like `0 0 29 2 *`. The presenter did three independent
walks per row, one backwards for "last run" and two forwards (re-parsing
each time) for the next run and the occurrence after it. At 100 rows
that is 300 calendar walks in one uninterrupted tick.
Run times now resolve for the whole page in one pass, in a new
`resolveScheduleTimings` that takes plain values rather than Prisma rows
so it can be tested and benchmarked on its own.
- **Nominal times are cached per `(cron, timezone)`** against a single
`now` pinned for the batch, so cost scales with the number of distinct
expressions instead of the number of rows. Rows in one response also
stop disagreeing about the current time.
- **The backwards walk is opt-in.** It is the most expensive of the
three and only the dashboard renders the column; the public API never
returned it at all.
- **Windowless schedules take one step instead of two.** The second step
only measures the interval to the following occurrence, and that
interval reaches the result solely through `min(intervalMs,
max(MINIMUM_SCHEDULE_RANGE_MS, windowMs))`. With no window `windowMs` is
0, and `CronPattern` rejects expressions with a seconds field, so
occurrences are always at least `MINIMUM_SCHEDULE_RANGE_MS` apart and
that `min` can never bind. It is also the costlier step, since it walks
a whole period rather than the remainder of the current one.
- **`nextScheduledTimestamps` steps one parsed expression** instead of
re-parsing per step, which also helps the single-schedule callers.
Behaviour is unchanged, error semantics included: a malformed expression
still throws for the next run and still degrades to an undefined last
run.
## Verification
Measured inside a real request against a live environment, 100
schedules: sparse expressions went from 2250-2652 ms to 23-30 ms, and
five distinct timezone expressions from 463-500 ms to 9.7-10.6 ms.
The new suite checks the optimized code against an inline copy of the
previous implementation across eleven cron and timezone combinations
plus five DST transitions, so the rewrite is verified as
behaviour-preserving rather than just faster. Separate tests pin the
invariant the single-step path depends on, so if sub-minute crons are
ever allowed they fail loudly instead of the timings quietly going
wrong.
Worth knowing for later: `cron-parser` v5 is a much faster rewrite on
exactly this workload (`prev()` under a timezone drops from roughly 2700
to 60 microseconds), but it is a breaking API change across several call
sites including the schedule engine, so it belongs on its own. The
differential test added here is the tool to de-risk it.
## Summary
Allow the logs search schema migration to run on ClickHouse versions
that require text index options to be literals.
## Root cause
The text index declared `lowerUTF8(search_text)` as a preprocessor
option. Some ClickHouse versions reject that column expression while
parsing index settings. The projected `search_text` is already
normalized to lowercase before insertion, so removing the redundant
preprocessor preserves search behavior.
Verified with the task events search integration tests.
## What
The one-off worker container boot is billed to whichever test resolves
the fixture first. This moves it into a `beforeAll` with its own
timeout.
## Why
vitest runs the fixture chain *inside* the test timer:
```js
// @vitest/runner 4.1.7
setFn(task, withTimeout(...withFixtures(handler)..., timeout, ...))
```
There is no `fixtureTimeout`. So booting Postgres (plus `CREATE
DATABASE`, schema push, ClickHouse and Redis) lands on the first test
and consumes a budget sized for test work.
That is why losing the image pre-pull on fork PRs was fatal rather than
merely slower: the extra ~10s crossed the 60s cap. Since fork time is
roughly internal + 10s and forks exceed 60s, internal runs were already
clearing that cap by under 10s — a latent flake regardless of forks.
## How
`withWarmup` wraps each fixture family and lazily registers a
`beforeAll` on first touch, with its own generous timeout. Registration
is lazy so only files that actually use a family pay for it —
`@internal/testcontainers` is imported by hundreds of test files, many
of which only need Redis. It registers once per file, since `isolate`
gives each file a fresh module registry.
Eight families are wrapped. `isolatedRedisTest`,
`replicationContainerTest` and `postgresAndRedisTest` are deliberately
untouched: they use per-test containers by design, so there is no
one-off boot to hoist.
No test file or CI changes, and it applies to every package using these
fixtures.
## Verification
Proven by mutation. `src/warmup.test.ts` runs container tests under a
deliberately tight cap:
| | Result |
| --- | --- |
| with the warm-up | passes |
| warm-up neutered | fails, `Test timed out` |
It is kept as a regression test — without it, unwrapping a fixture would
break nothing visibly.
`triggerFailedTask.call.test.ts`, one of the five shard casualties,
passes locally in 20.4s.
## Also here
`@internal/testcontainers` had no `test` script, so `turbo run test
--filter "@internal/*"` skipped the package and its existing
`heteroDedicated.test.ts` never ran in CI. Adding the script (matching
the sibling packages') runs both files; verified green through turbo
exactly as CI invokes it.
## What
Three corrections to the pre-pull lists, each verified against what the
suites actually use.
## Changes
**`ryuk:0.11.0` -> `0.14.0`** in `e2e-webapp.yml` and
`e2e-webapp-auth-full.yml`. The installed testcontainers hardcodes the
image it starts:
```js
// testcontainers@11.14.0 build/reaper/reaper.js
: ImageName.fromString("testcontainers/ryuk:0.14.0").string;
```
So those two lines were pre-pulling an image nothing starts, and the one
actually used was never pre-pulled. The other three workflows already
say 0.14.0.
**`postgres:17` added** to `unit-tests-webapp.yml`. The webapp suite
references `docker.io/postgres:17` across 10 files but only
`postgres:14` was pre-pulled. `unit-tests-internal.yml` already pulls
both.
**Electric pinned to its digest** in `unit-tests-webapp.yml`. The tests
run `electricsql/electric:1.2.4@sha256:20da...` while the pre-pull asked
for the bare tag, so the pre-pull did not necessarily populate the
manifest the tests then request.
## Not changed
The otel collector and s2 images are pulled by other workflows but are
not used by the webapp suite, so they are deliberately not added here.
`postgresAndRedisTest` uses per-test containers by design and needs
nothing pre-pulled.
## What
The `Pre-pull testcontainer images` step is gated on
`env.DOCKERHUB_USERNAME`. Fork PRs receive no repository secrets, so
that variable is empty and the step is skipped along with the DockerHub
login it was grouped with.
## Why
With the pre-pull skipped, testcontainers pulls images lazily — inside
the first test that resolves the fixture, against that test's
`testTimeout`. On PR #4534 that pushed five webapp shards past their 60s
cap across three runs, each failing as `Test timed out in 60000ms` while
42 of 43 files in the shard passed.
Measured cost of the missing pre-pull, comparing the delta from vitest
start to the first container fixture on the same runner class:
| Run | Delta |
| --- | --- |
| internal x2 | +139.9s, +139.4s |
| fork x2 | +149.7s, +149.4s |
A 10.0s penalty, bimodal to within 0.3s.
Note the pulls themselves succeed anonymously — there are no rate-limit
errors in any of the failing logs. Only the login needs credentials, so
the pre-pull can run unconditionally.
## Scope
Removes the `if:` from the pre-pull step in all five workflows that have
one. The DockerHub login stays gated, since it genuinely needs secrets.
## Summary
Memoize shared context values so provider renders do not unnecessarily
rerender every consumer. Oxlint now enforces this pattern for the rest
of the dashboard.
Base: [#4677](https://github.com/triggerdotdev/trigger.dev/pull/4677)
## Summary
Enable lint rules that prefer direct iteration and concise function
callback types.
The existing code now uses direct iteration where no index is needed,
and callback contracts use function types consistently.
Base: [#4675](https://github.com/triggerdotdev/trigger.dev/pull/4675)
## Summary
Enable JSX cleanup rules for shorthand fragments and self-closing
components.
The existing JSX is automatically simplified, and future components will
follow the same concise form.
Base: [#4673](https://github.com/triggerdotdev/trigger.dev/pull/4673)
## Summary
Enable small cleanup rules for redundant boolean expressions, object
ownership checks, assignments, and object construction.
The existing call sites now use the simpler equivalent forms, keeping
future code consistent without changing behavior.
Base: [#4672](https://github.com/triggerdotdev/trigger.dev/pull/4672)
## Summary
Enable additional lint rules that catch unsafe optional-chain
assertions, inherited-property iteration, anonymous symbols, and unsafe
external links.
The existing violations now use explicit values and own-property checks,
so the rules can prevent those patterns from returning.
Adds an optional priority class for run pods.
```
KUBERNETES_RUN_POD_PRIORITY_CLASS_NAME
```
When set, the value is applied as `priorityClassName` on the run pod
spec. When unset, pods are created exactly as before.
Off by default, and inert unless set. It sits beside the existing
`KUBERNETES_SCHEDULER_NAME` option and follows the same conditional
shape:
```ts
...(env.KUBERNETES_RUN_POD_PRIORITY_CLASS_NAME
? { priorityClassName: env.KUBERNETES_RUN_POD_PRIORITY_CLASS_NAME }
: {}),
```
## Verification
`typecheck --filter supervisor`, `format` and `lint` clean. No changeset
or `.server-changes/` note: off by default, no user-visible behaviour
change.
## What
Runs that carry no external trace context (schedules, task-to-task
triggers) fall back to a trace id generated once in the [`TracingSDK`
constructor](https://github.com/triggerdotdev/trigger.dev/blob/main/packages/core/src/v3/otel/tracingSDK.ts#L165).
With `experimental_processKeepAlive` the SDK outlives the run, so every
run on a warm process is exported to the external OTLP endpoint under
that one id.
Across our production traces, 80.3% contained spans from more than one
run, worst case 25. Per-run cost and latency attribution is unusable as
a result. This is the same warm-start hazard c043c4a6a fixed for the
external-context path, which left the fallback captured at construction.
## How
`FallbackExternalTraceIds` hands out one id per internal trace, shared
by the span and log wrappers so a run's spans and logs agree.
The id is keyed off the record's own internal trace id rather than
ambient state at export time, because batch processors drain
asynchronously and a run's records routinely export after the next run
has started. The map is bounded and evicts least-recently-used, so a run
that is still exporting can't lose its id.
Granularity follows the internal trace, so a run and the runs it
triggers stay on one trace.
**Risk:** the wrappers only exist when `exporters` / `logExporters` are
configured, so deployments that don't export externally are untouched.
Nothing outside `tracingSDK.ts` changes.
**Known gap (pre-existing):** sampling and id selection still branch on
ambient `getExternalTraceContext()`, so records draining across a run
boundary in mixed mode are misplaced in both directions. It can't use
the approach here — the external id comes from the run's incoming
`traceparent`, which isn't carried on the record — so closing it means
capturing `internalTraceId -> external context` in a span processor.
Happy to follow up separately.
---
## Testing
`packages/core` suite passes. `pnpm run format` and `pnpm run lint:fix`
produce no diff.
Six cases in `externalSpanExporterWrapper.test.ts`, each
mutation-checked rather than just observed passing: one id per run,
stability within a run, correct id when records drain after the next run
started (spans and logs together), external export stays off when
unconfigured, retention of a run still exporting while the map churns,
and the bound itself.
**CI:** the five failing `webapp` shards are the ones containing
`containerTest` suites. Fork PRs receive no repository secrets, so
`unit-tests-webapp.yml` skips the DockerHub login and the image pre-pull
(both gated on `env.DOCKERHUB_USERNAME`) and the container tests time
out at 60s. Same five shards across five runs, every failure a 60s
timeout, and those shards pass on internal PRs. Happy to be corrected if
you can run them with secrets available.
---
## Changelog
Unrelated runs are no longer merged into a single trace in your external
observability tool when they happen to execute on the same warm worker
process. A run and the runs it triggers still share one trace, so a run
tree stays together.
---
## Screenshots
_n/a_
---
_Supersedes #4526 (auto-closed before I was vouched) and #4533 (opened
ready rather than as a draft). GitHub won't reopen either._
---------
Co-authored-by: Claude Opus 5 (1M context) <noreply@anthropic.com>
Co-authored-by: Iss <74388823+isshaddad@users.noreply.github.com>
Co-authored-by: nicktrn <55853254+nicktrn@users.noreply.github.com>
<!-- ccr-slack-attribution -->
_Requested by **Matt Aitken** · [Slack
thread](https://triggerdotdev.slack.com/archives/C0BKB98B84W/p1787045331358929)_
Copy-only reword of the banner shown to org admins who have not set a
billing limit yet.
**Before** — the banner read "Protect your organization from unexpected
usage spikes." with a button labelled "Configure billing limit".
**After** — it reads "Add a billing limit to your account to prevent
overspending" with a button labelled "Billing limit settings".
The new wording names the action up front and matches the destination it
sends you to, so the banner reads as a settings link rather than a
one-off setup step.
## ✅ Checklist
- [x] I have followed every step in the [contributing
guide](https://github.com/triggerdotdev/trigger.dev/blob/main/CONTRIBUTING.md)
- [x] The PR title follows the convention.
- [x] I ran and tested the code works
---
## Testing
Formatting and linting pass (`oxfmt --check`, `oxlint`). No tests or
snapshots assert this copy. The change is two string literals in one
component, with no behaviour attached.
---
## Changelog
Reworded the billing-limit banner for organizations without a limit
configured, and relabelled its button to "Billing limit settings".
---
## How
Both strings live in `NoLimitConfiguredBanner` in
`apps/webapp/app/components/billing/OrgBanner.tsx`: the heading is the
`canManageBillingLimits` branch of the banner's children, and the label
is the `<span>` inside the `LinkButton`. Only those two literals
changed. The button still points at `v3BillingLimitsPath(organization)`
(`/orgs/{slug}/settings/billing-limits`), so routing, permissions and
the non-admin variant of the message are untouched.
Co-authored-by: Claude <noreply@anthropic.com>
Adds KUBERNETES_RUNNER_SECURITY_CONTEXT (off | baseline | restricted), selecting how constrained the run container is.
baseline drops the capability bounding set and blocks privilege escalation. restricted additionally pins the container to a non-root uid, chosen by runtime so bun images get their own.
Default is off, so this is inert on merge.
## Summary
A run triggered with a `ttl` could get permanently stuck showing as
queued. If the run started executing and was then requeued after a
failure (a stalled heartbeat, a worker dying mid-run) once its TTL had
already elapsed, the next dequeue pass silently dropped it from every
queue structure. The run stayed QUEUED in the database forever, and
nothing (dequeue, the TTL consumer, queue repair) could ever see it
again.
## Root cause
Enqueue registers a TTL entry for the TTL consumer, and the first
dequeue removes it ("the run is executing, not expired"). A nack rewrote
the message preserving the original `ttlExpiresAt` without
re-registering that entry. The next dequeue pass then took the
expired-TTL branch: remove the run from the queue sorted sets and leave
the message for the TTL consumer to finalize. But the consumer's entry
was gone, so nothing ever finalized the run.
The fix has two halves:
- `nackMessage` drops `ttlExpiresAt` from the rewritten message. TTL
only applies to runs that have never been dequeued (the same contract as
`includeTtl` on re-enqueues), so a requeued run stays dequeuable and is
never expired by its original deadline.
- The dequeue expired-TTL branches now (re-)register the TTL entry
instead of assuming it exists, so any message still carrying a lapsed
`ttlExpiresAt` with no TTL entry (including ones written before this
fix) finalizes as EXPIRED instead of orphaning.
## Verification
New engine test suite `ttlNackRequeue.test.ts` (testcontainers, real
Redis and Postgres). All four tests fail before the fix and pass after:
- a heartbeat-stalled EXECUTING run with a lapsed TTL is requeued and
dequeued again instead of orphaned (the full production failure chain)
- requeue-after-failure strips `ttlExpiresAt` so later dequeues do not
treat the run as expired
- a lapsed-TTL message whose TTL entry is missing is re-registered by
dequeue and finalized as EXPIRED, for both plain and concurrency-key
queues
Also ran the existing ttl, heartbeats, dequeuing and attemptFailures
engine suites plus the full run-queue suite (149 tests) against the
change.
Adds two optional env vars that rewrite the registry host of run pod images at pod creation, so a supervisor can pull from a registry in its own region. Off by default and inert unless both are set. Exact host-prefix matching, so look-alike hosts pass through untouched.
Replaces the hardcoded runner seccomp profile path with KUBERNETES_RUNNER_SECCOMP_PROFILE_PATH, and the node-24-only condition with KUBERNETES_RUNNER_SECCOMP_PROFILE_RUNTIMES (none | node-24-plus | all).
Both defaults reproduce current behaviour, so this is inert on merge. Widening the scope or turning attachment off becomes a config change rather than a deploy.
The supervisor now supports routing an organization's runs to specific
nodes. `KUBERNETES_ORG_PLACEMENT_OVERRIDES` takes JSON keyed by the
internal org ID, adding node selector entries and tolerations to that
org's run pods, e.g. to route an org onto a dedicated, tainted node
pool:
```json
{"<orgId>": {"nodeSelector": {"pool": "dedicated"}, "tolerations": "dedicated=runs:NoSchedule"}}
```
The node selector merges over the defaults (the override wins on key
collision, with a warning logged). Tolerations append to the existing
runner and scheduled-run sets. Overrides are validated at startup
similar to `KUBERNETES_RUNNER_TOLERATIONS`.
Exposed in the Helm chart as
`supervisor.config.kubernetes.orgPlacementOverrides`, where tolerations
can also be given as a list.
## What & why
The dashboard agent can now run its model calls through AWS Bedrock
instead of the direct Anthropic API, chosen by a single env switch. It's
**off by default** (`DASHBOARD_AGENT_MODEL_PROVIDER` unset ⇒
`anthropic`), so merging changes nothing at runtime — the Bedrock path
is a dormant branch until an operator sets the switch and AWS config.
The default Anthropic path is byte-for-byte unchanged.
This also carries a related tenant-isolation hardening for the agent's
delegated token (kept together deliberately — both land the agent on
Bedrock for HIPAA readiness). Refs: TRI-13251, TRI-11032.
## What's inside
**Provider seam** —
`internal-packages/dashboard-agent/src/model-provider.ts`: the registry
now holds both `anthropic` and `bedrock`; `resolveDashboardAgentModel()`
maps the canonical `"anthropic:<id>"` strings the managed prompts carry
to the active provider, and the cache-breakpoint helpers emit the active
provider's shape — Anthropic `cacheControl` vs Bedrock `cachePoint`.
Managed prompt strings stay canonical, so stored prompts don't change
meaning. Unmapped model ids throw rather than shipping a guaranteed-404
profile. All agent, watch, compaction and title callsites route through
the resolver; the `dashboardAgentModelKey` locals override (test mock
injection) is preserved.
**Cache telemetry** — `step-cache.ts`: cache token usage is read from
the active provider (Anthropic reports it on provider metadata; Bedrock
reports the write on metadata and the read via standard usage), so
`gen_ai.usage.cache_*` is populated on both. This also fixes a latent
ordering bug where step attributes could null-overwrite the prompt-cache
read count.
**Webapp callsites** — `dashboardAgentHeadStart.server.ts` and the
head-start route resolve the model and the cache breakpoint through the
same seam, so the warm-up prefix and the following turn share one
provider. The head-start firing gate is provider-aware: on Bedrock it
gates on `AWS_REGION` and lets the SDK resolve credentials (IAM role /
static keys / session token / bearer), so a role-based deploy still
warms; on Anthropic it stays `Boolean(ANTHROPIC_API_KEY)`.
`app/env.server.ts` gains the optional AWS vars and validates
`DASHBOARD_AGENT_MODEL_PROVIDER`. `ANTHROPIC_API_KEY` is untouched and
not required on a Bedrock deploy.
**Tenant-isolation hardening** —
`internal-packages/rbac/src/fallback.ts`: for a **scoped** context, the
OSS `authenticateUserActor` now applies the same membership floor as the
session path — a delegated user-actor token whose user is not a member
of the scoped org/project is denied (403). Unscoped tokens keep their
prior behavior (no tenant claim, no lookup). The user lookup falls back
replica→primary so replication lag can't spuriously 401 a just-joined
member. Members and admins are unaffected. Previously this invariant
held only through per-route discipline; this makes it structural.
## Enabling Bedrock (later, ops)
- Set `DASHBOARD_AGENT_MODEL_PROVIDER=bedrock` **identically** in both
the webapp and the agent task container — the webapp warms the cache
prefix and the task reads it, so a split would silently miss the cache.
- Set `AWS_REGION` and provide credentials the Bedrock SDK can resolve
(IAM role preferred). For v1 this runs **without** an Anthropic API key.
Note: with no Anthropic key set, rollback is "turn the agent off", not
"unset the switch" (unsetting falls back to the Anthropic provider,
which then has no key).
- Two things to confirm before rollout: the Sonnet inference-profile id
is validated against the SDK's own model-id union but still warrants a
live smoke test; and Bedrock prompt caching for Sonnet is a 5-minute
window (not Anthropic's 1h), so input-token cost rises when flipped.
## Testing
Unit tests cover both provider paths: the provider switch and
per-provider cache shapes, a structural regex asserting Bedrock ids are
real inference profiles (not an echo of the table), the split-metadata
cache telemetry, and real-Postgres RBAC tests — member allowed, scoped
non-member denied (org-only and project-only), missing user → 401, admin
non-member exempt, unscoped success. `typecheck --filter webapp` and the
dashboard-agent + rbac suites pass.
## Summary
When an AI SDK tool call failed inside a run, the span showed up under
the "Errors only" filter but the span inspector gave no hint of what
went wrong. The exception was recorded on the span all along; the
`ai.toolCall` and `ai.embed` inspector views just never rendered span
events. Failed tool call and embedding spans now show the standard error
block (message plus stack trace) below the Input section.
## Root cause
Generic spans render exception span events via the `SpanEvents`
component, but the AI-specific span entities replace the whole panel
with their own layout and dropped the events entirely. The span's events
are now passed into `AIToolCallSpanDetails` and `AIEmbedSpanDetails` and
rendered with the same `SpanEvents` component the generic view uses.
Errored generation spans (`ai.generateText` and friends) use a tabbed
view and still don't surface errors; that needs its own design pass and
is left for a follow-up.
## The bug
A concurrency key is an unrestricted client string
(`ConcurrencyKeySchema` is `z.union([z.string(),
z.number()]).transform(String)`), and `concurrencyKeySection` does no
escaping, so `*` reaches the queue raw. `queueKey` then renders it as
`...:queue:<q>:ck:*`, which is byte-identical to the wildcard member the
CK scripts keep in the master queue to mean "this base queue has
concurrency-key work".
Every CK script ends with the same pair:
```lua
-- Rebalance master queue with ck:* member
redis.call('ZADD', masterQueueKey, earliestIdx[2], ckWildcardName)
-- Remove old-format entry from master queue (transition cleanup)
redis.call('ZREM', masterQueueKey, queueName)
```
`ckWildcardName` is `toCkWildcard(message.queue)`, and for a `*`-keyed
run that returns the identical string, so the cleanup on the second line
deletes what the rebalance on the first line just wrote.
The master queue then has no entry for that base queue, while `ckIndex`
and the variant queues still hold the work. **Every concurrency key on
the queue stops being dequeued**, not just the `*` one. It is silent,
and it only recovers if some later write happens to re-add the member.
Reproduced before the fix:
```
master queue AFTER normal ck enqueue: ["{org:...}:queue:task/my-task:ck:*"]
master queue AFTER ck='*' enqueue: []
ckIndex members (work still queued): [":ck:user-1", ":ck:*"]
dequeued: []
```
Blast radius is bounded to the environment that triggers it, so it is
self-inflicted rather than cross-tenant, but a single trigger stalls the
queue for everything on it.
## The fix
Guard the cleanup so it never removes the wildcard member:
```lua
if queueName ~= ckWildcardName then
redis.call('ZREM', masterQueueKey, queueName)
end
```
Applied to all 10 CK scripts (4 enqueue, 6 ack/nack/dead-letter). No
key-format change and no migration: a queue already stranded in Redis is
repaired by its next write.
I considered rejecting `*` at the API boundary instead and rejected it.
Existing Redis state and `TaskRun.concurrencyKey` rows already hold raw
`:`-bearing and `*` keys, so changing key construction would orphan
in-flight messages and split concurrency accounting mid-deploy. Boundary
validation would still be reasonable as belt-and-braces later, but the
Lua guard alone fixes it including for state already out there.
## Testing
`ckWildcardKey.test.ts` covers the enqueue, ack and nack paths. All
three pass with the guard and **all three fail without it**, verified by
reverting. Full `src/run-queue/` suite is green (166 tests).
## Note for #4367
The virtual-time branch adds three more CK scripts with the same pattern
(`enqueueMessageCkVtimeTracked`, `enqueueMessageWithTtlCkVtimeTracked`,
`nackMessageCkVtimeTracked`). They do not exist on main so they are not
in this PR; the same guard needs applying there, and I will do that on
that branch.
## Summary
`lefthook.yml` has been in the repo since #4147, but nothing installs
lefthook and nothing runs `lefthook install`, so the pre-push hook it
describes has never fired for anyone. #3977 had removed the `lefthook`
devDependency a week before #4147 landed, and #4147 only added the
config file.
This supplies the missing half:
```diff
+ "prepare": "lefthook install",
+ "lefthook": "^2.1.10",
"onlyBuiltDependencies": [
+ "lefthook",
```
With those in place, `pnpm install` wires the hook up on clone, and the
format and lint checks actually run before a push instead of first
failing in CI.
Also here: the pre-push jobs run in parallel rather than in sequence,
and `CONTRIBUTING.md` documents the hook, including how to skip it and
the fact that GitButler only runs hooks when "Run hooks" is enabled in
its settings.
`lefthook@2.1.10` is the current release.
<!-- ccr-slack-attribution -->
_Requested by **Matt Aitken** · [Slack
thread](https://triggerdotdev.slack.com/archives/C045W9WM3E1/p1786948064703889?thread_ts=1786948064.703889&cid=C045W9WM3E1)_
Adds `gtremper` to `.github/VOUCHED.td`.
Before: PRs from `gtremper` are auto-closed by the vouch check.
After: `gtremper` is vouched, so their PRs stay open and run CI.
Done as a direct file edit rather than the issue-comment flow because
there is no open Vouch Request issue for this user, matching the
precedent in #3804.
Co-authored-by: Claude <noreply@anthropic.com>
## Summary
`packages/core` declared `socket.io`, the server package, but never
imported it. Its only Socket.IO usage is the client:
```
packages/core/src/v3/zodSocket.ts
packages/core/src/v3/runEngineWorker/supervisor/session.ts
import { io } from "socket.io-client";
```
The only occurrence of `socket.io` outside those client imports was the
`package.json` line itself. Since `@trigger.dev/core` is published, that
line meant every consumer installed a server package nothing in the tree
imports.
`socket.io-client` is untouched. `apps/webapp` and `apps/supervisor`
keep their own `socket.io` dependencies, so the server side is
unaffected.
Found with `pnpm run knip:deps`, which the repo already ships.
`pnpm run typecheck` passes across all 57 workspaces, and
`@trigger.dev/core` builds clean.
Stacked on #4639.
## Summary
`find-my-way` was resolving `9.3.0` even though its only parent,
`fastify@5.8.5`, declares `^9.0.0` and so already permitted a newer
release. The lockfile had not re-resolved since. This adds a floor so it
lands on a current 9.x:
```json
"find-my-way@>=9 <9.7.0": "^9.7.0"
```
It resolves to `9.7.0`. Nothing outside the 9.x line is touched, and no
parent is asked to accept anything its declared range did not already
allow.
The whole path is development only: `find-my-way` arrives through
`fastify`, which arrives through `evalite`, a devDependency of
`apps/webapp` used by the `eval:dev` harness.
Stacked on #4638.
## Summary
The existing `ip-address` override is scoped to a single parent,
`@jsonhero/json-infer-types>ip-address`. A second parent reaches
`ip-address` independently: `express-rate-limit@8.6.0`, which is itself
pinned by our `@modelcontextprotocol/sdk@>=1.26.0>express-rate-limit`
override. That path was resolving `10.2.0` while the scoped path
resolved `10.5.0`, so the tree carried two copies.
This adds a matching scoped override for the second parent:
```json
"express-rate-limit>ip-address": "^10.3.1"
```
`express-rate-limit` declares `^10.2.0`, so this asks nothing of it that
its own range did not already allow. The tree now resolves a single
`ip-address@10.5.0`.
The existing `@jsonhero/json-infer-types` override stays: that package
declares `ip-address: ^8.1.0`, so removing it brings an 8.x copy back.
Stacked on #4637.
## Summary
`nanoid` was pinned at exactly `3.3.8` in five manifests. Two of those
five never imported it: in `internal-packages/schedule-engine` and
`internal-packages/webhook-engine` the only occurrence of the string
`nanoid` in the entire package was the `package.json` line itself. Both
are removed rather than bumped.
The three that genuinely use it move to `3.3.18`, a version already
present in the tree via `postcss`, so this pulls in nothing new.
| Package | Uses it | Change |
| --- | --- | --- |
| `internal-packages/schedule-engine` | no | removed |
| `internal-packages/webhook-engine` | no | removed |
| `apps/webapp` | yes | `3.3.8` to `3.3.18` |
| `packages/core` | yes | `3.3.8` to `3.3.18` |
| `internal-packages/run-engine` | yes | `3.3.8` to `3.3.18` |
| `packages/redis-worker` | yes | `^5.0.7` to `^5.1.16` |
`redis-worker` is on the 5.x line and is included because its declared
range already permitted a newer release; the lockfile had simply not
re-resolved, leaving it on `5.1.2`.
The unused declarations were found with `pnpm run knip:deps`, which the
repo already ships.
`pnpm run typecheck` passes across all 57 workspaces.
## Summary
`socket.io` was pinned at exactly `4.7.4` in three manifests
(`apps/webapp`, `apps/supervisor`, `packages/core`). That pin capped
`engine.io` at 6.5.4, because 4.7.4 declares `engine.io: ~6.5.2`.
Moving all three pins to `4.8.3` lifts that cap: 4.8.3 declares
`engine.io: ~6.6.0`. The webapp's direct `engine.io` devDependency moves
from `^6.5.4` to `^6.6.7` to match.
These are direct dependencies, so they are bumped in place rather than
forced with an override.
## Result
The tree previously carried two `engine.io` copies. It now carries one:
```
engine.io@6.6.8
└─┬ socket.io@4.8.3
├── @trigger.dev/core (dependencies)
├─┬ react-email
│ └── emails (devDependencies)
├── supervisor (dependencies)
└── webapp (dependencies)
```
`react-email` was already resolving `socket.io@4.8.3` in this same tree,
so that combination was already running here before this change.
## Servers move, clients do not
This bumps `socket.io` (the server) only. `socket.io-client` stays at
`4.7.5` in `packages/core` and `packages/cli-v3`, deliberately: the fix
is server-side, and clients ship inside user deployments, so leaving
them alone keeps the blast radius small. That means a 4.8.3 server will
be talking to 4.7.5 clients indefinitely, which is worth being explicit
about.
That pairing is safe because neither wire protocol changed. Both
versions report the same protocol numbers:
| | 4.7.4 | 4.8.3 |
| --- | --- | --- |
| Socket.IO protocol (`socket.io-parser`) | 5 | 5 |
| Engine.IO protocol (`engine.io-parser`) | 4 | 4 |
The version bump moves `socket.io-parser` 4.2.6 to 4.2.7 and `engine.io`
6.5.4 to 6.6.8, but the protocol constants each exports are unchanged.
The 4.8.0 changes are additive on the client (custom transport
implementations, a `tryAllTransports` option) and bug fixes on the
server.
Verified rather than assumed, with a cross-version matrix covering both
transports and both directions:
```
PASS server 4.8.3 <- client 4.7.5 websocket / polling
PASS server 4.8.3 <- client 4.8.3 websocket / polling
PASS server 4.7.4 <- client 4.7.5 websocket / polling
PASS server 4.7.4 <- client 4.8.3 websocket / polling
```
Each case exercised connect, a server-initiated emit, `emitWithAck`,
room join, room broadcast, and a binary payload. Compatibility holds in
both directions, so there is no upgrade-ordering requirement between
server and client.
`pnpm run typecheck` passes across all 57 workspaces.
Stacked on #4634.
## Summary
`axios` was resolving to 1.16.1 through `@slack/web-api`, which declares
`^1.16.0`. The lockfile had simply not re-resolved since, so the tree
sat on an older 1.x release than the range allows.
This adds a scoped override so the 1.x line picks up a current release:
```json
"axios@>=1.15.2 <1.18.0": "^1.18.0"
```
It resolves to 1.19.0. No parent bump is needed, since `^1.16.0` already
permits it, and `@slack/web-api` is the only consumer.
Stacked on #4633 so the two lockfile changes do not collide.
## Summary
`npm-run-all` has had no release since 4.1.5 in 2018, and pnpm now
covers the one thing we used it for. The webapp's `build` script was its
only consumer anywhere in the repo, so the dependency goes away
entirely.
`run-s build:**` becomes an explicit chain:
```
pnpm run build:remix && pnpm run build:server && pnpm run build:otlpworker && pnpm run build:sentry && pnpm run upload:sourcemaps
```
## Why this shape
I compared both forms side by side against the real `run-s` before
swapping:
| Behaviour | `run-s build:**` | explicit chain |
| --- | --- | --- |
| Scripts selected | remix, server, otlpworker, sentry | identical |
| Order | declaration order | identical |
| `upload:sourcemaps` matched by the glob | no | no |
| Second script fails | aborts, third never runs | identical |
| Exit code on failure | `1` | `1` |
`pnpm run --sequential "/^build:/"` was the closer-looking option, but
it keeps running scripts after one fails, so it is not a faithful
replacement.
The one thing given up is that `build:**` automatically picked up any
new `build:*` script, where the chain has to be edited. With four
entries that felt like the better trade.
`pnpm run build --filter webapp` passes end to end locally, all five
steps in order.
## Summary
Following a link straight into an organization's settings (for example
the usage limit link in a billing email) and then clicking "Back to app"
took you to `/`, which resolves to whichever organization you last had
selected, not the one whose settings you were looking at. The button now
links to the organization in the URL, so you land back in the org you
came from.
The org index route already redirects to the best project in that org,
so the destination is unchanged apart from being the right org.
Account settings still links to `/`, since that page is not org scoped
and has no org to return to.
## Summary
A number of `pnpm.overrides` entries had drifted behind the releases
they were written against. An override fixes the resolved version
outright, so in every one of these cases the tree was pinned to the
floor value rather than picking up later releases in the same line. This
raises each floor to a current release, and widens the selectors that
were scoped to an exact upper bound so they keep matching.
| Override | Before | After |
| --- | --- | --- |
| `body-parser` (under `express@^4`) | `1.20.3` | `^1.20.6` |
| `tar` | `7.5.19` | `7.5.21` |
| `hono` | `4.12.25` | `4.12.34` |
| `undici` (6.x) | `6.27.0` | `6.28.0` |
| `undici` (7.x) | `7.28.0` | `7.29.0` |
| `js-yaml` (3.x) | `3.14.2` | `3.15.1` |
| `js-yaml` (4.x) | `4.1.1` | `4.3.1` |
| `dompurify` | `^3.4.1` | `^3.4.13` |
| `vite` | `^6.4.2` | `^6.4.3` |
| `protobufjs` | `^7.5.6` | `^7.6.5` |
| `socket.io-parser` | `^4.2.6` | `^4.2.7` |
| `postcss` | `^8.5.10` | `^8.5.23` |
| `fast-uri` | `^3.1.2` | `^3.1.5` |
| `brace-expansion` (1.x) | `1.1.13` | `1.1.18` |
| `brace-expansion` (2.x) | `2.0.3` | `2.1.4` |
| `brace-expansion` (5.x) | `5.0.6` | `5.0.9` |
| `ip-address` (under `@jsonhero/json-infer-types`) | `^10.2.0` |
`^10.3.1` |
Every parent's declared range still accepts the new resolution, so
nothing is forced outside its stated bounds by this change.
Two of these changed a default rather than just moving version.
`js-yaml` 4.2.0 stopped resolving underscore-separated scalars such as
`1_000` as numbers, which is the YAML 1.2 behaviour, and there are none
in any YAML in this repo. `brace-expansion` 2.1.x now caps expansion
size by default, well above anything a real glob produces, and
`minimatch` calls it with no options. Neither is reachable from how we
use them.
`undici@5.29.0` and `vite@4.4.9` are left alone: their parents cap below
the newer lines, so moving either would mean taking the parent across a
major.
Verified with a clean install, and `pnpm run typecheck` passes.
## Summary
The server half of hosted webhooks: the public ingress endpoint,
signature verification, the delivery pipeline (Postgres partitioned
storage + ClickHouse for ordering), the in-app partition manager, the
HTTP API, and the dashboard (Deliveries, Endpoints, and the in-app test
console).
The public SDK and docs half is #4537. That PR carries the user-facing
API (`webhook()`, `chat.event` / `chat.channels`, the
`@trigger.dev/slack` connector) and builds on the shared
`@trigger.dev/core` schemas that ship here.
## Shipping behind a flag
A `WEBHOOK_ENABLED` env var (default off) gates the public ingress route
and the engine worker plus partition cron, so merging and deploying this
changes nothing in production until it is flipped on per environment.
The dashboard is separately gated per org by the `hasWebhooksAccess`
feature flag.
## Note on packages
This PR includes the `@trigger.dev/core` schema additions the server
compiles against, but carries no changeset. Core is not consumed
independently of the SDK, so it is released together with the SDK via
#4537. Keeping its changeset off `main` means no release cut from `main`
publishes it early.
## What
Makes two transaction-resilience behaviors real and env-var
configurable, defaults set to the good values, so we can tune during and
after the Aug 15 database patch window without a redeploy:
- **maxWait 2s → 10s** (TRI-12982): how long Prisma waits to borrow a
connection before it can `BEGIN`. A restart freeze holds the pool full,
and the only thing that errored was transaction starts giving up at 2s.
- **Retry transaction-start P2028-at-acquisition** (TRI-12984): when
Prisma can't borrow a connection within `maxWait` it raises P2028
(`Unable to start a transaction in the given time`) and **no SQL ran**,
so retrying is safe. Scoped narrowly: only that error (never P2024
pool-exhaustion), 2 attempts, jittered backoff, and a token-bucket
budget so a mass freeze can't amplify into a retry storm.
## Env vars (`DATABASE_*` convention)
Generic defaults:
| var | default |
|---|---|
| `DATABASE_TRANSACTION_MAX_WAIT_MS` | `10000` |
| `DATABASE_TRANSACTION_START_RETRY_ENABLED` | `true` (kill switch) |
| `DATABASE_TRANSACTION_START_RETRY_MAX_ATTEMPTS` | `2` |
| `DATABASE_TRANSACTION_START_RETRY_BACKOFF_MIN_MS` | `50` |
| `DATABASE_TRANSACTION_START_RETRY_BACKOFF_MAX_MS` | `250` |
| `DATABASE_TRANSACTION_START_RETRY_BUDGET_PER_SEC` | `50` |
| `DATABASE_TRANSACTION_START_RETRY_BUDGET_BURST` | `100` |
Per-writer-pool overrides, each falling back to the generic when unset
(same pattern as the per-client pool/connect-timeout work):
`RUN_OPS_DATABASE_TRANSACTION_*` and
`RUN_OPS_LEGACY_DATABASE_TRANSACTION_*` (all 7 knobs each). Transactions
only open on writer pools, so those are the only pools with their own
knobs. Each pool gets its **own** token bucket, so a storm on one pool
can't drain another's retry budget.
## Design
- The retry primitives live in `internal-packages/database` and never
read `process.env` (IoC): a P2028-at-acquisition classifier, a
`TokenBucketRetryBudget`, and `withTransactionStartRetry`, folded into
the `$transaction` helper via a new `startRetry` option. Config is
resolved at the app boundary and threaded in.
- The `$transaction` helper is the chokepoint (wraps the whole
transaction), not the per-statement `$allOperations` extension.
- The run engine's writes go through `PostgresRunStore`'s own
`.$transaction(...)`, not the webapp helper, so both the helper and the
two `PostgresRunStore` sites apply maxWait + retry (sharing the per-pool
config). Builds on the `options?: { timeout, maxWait }` seam added in
#4514.
- Webapp `$transaction` call sites get the default `maxWait` + retry
injected at one merge point, so no call site needed editing.
## Evidence
- Unit red/green in `internal-packages/database`: reverting the helper
wiring turned the acquisition-retry test red (`Unable to start a
transaction in the given time`), re-applying it green. Full package
suite 25/25. Covers: classifier (P2028-acq yes, P2024 no, in-tx P2028
no), retry (retry-then-succeed, no-retry P2024, stop at maxAttempts,
disabled, budget-exhausted, jitter bounds), token bucket, and
`$transaction` wiring.
- Typecheck clean: webapp, run-store, run-engine.
- Full-stack run: bounded queue-ay pass (15 projects, real dev runs
through the run-engine `PostgresRunStore` transaction path). 13 pass;
the 2 failures are one documented known-failure and one
stale-worker-state flake that passes 2/2 with this change active on a
fresh app.
- Boots cleanly with per-pool overrides set.
## Configuration & rollout
Ship **inert** first (zero behavior change), then flip to the good
values **live via env** — no redeploy needed for either.
### Inert — behaves exactly as today
```
DATABASE_TRANSACTION_MAX_WAIT_MS=2000 # Prisma's built-in default (change defaults to 10000)
DATABASE_TRANSACTION_START_RETRY_ENABLED=false # disable the new retry entirely
```
`maxWait=2000` is what every path used before (Prisma's default; the
run-store sites and the helper passed no maxWait). `retry=false`
short-circuits `withTransactionStartRetry` to a single run and makes the
serialization-retry exclusion a no-op. Verified on the pooler-freeze
rig: identical fail-fast P2028 at ~2003ms with zero retries —
byte-for-byte current behavior, across all pools.
### Production ("good") — the baked defaults
Rely on defaults (nothing to set) or set explicitly:
```
DATABASE_TRANSACTION_MAX_WAIT_MS=10000
DATABASE_TRANSACTION_START_RETRY_ENABLED=true
DATABASE_TRANSACTION_START_RETRY_MAX_ATTEMPTS=3 # 3 attempts (2 retries); ~30s acquisition tolerance covers a ~20-25s freeze
DATABASE_TRANSACTION_START_RETRY_BACKOFF_MIN_MS=50
DATABASE_TRANSACTION_START_RETRY_BACKOFF_MAX_MS=250
DATABASE_TRANSACTION_START_RETRY_BUDGET_PER_SEC=50
DATABASE_TRANSACTION_START_RETRY_BUDGET_BURST=100
```
Per-pool overrides `RUN_OPS_DATABASE_TRANSACTION_*` and
`RUN_OPS_LEGACY_DATABASE_TRANSACTION_*` (all seven knobs each) are
optional and fall back to the generic set — not needed for v1; the
generic set covers the control-plane, run-ops, and run-ops-legacy writer
pools. Readers open no transactions and take nothing.
**Guardrail:** the retry only engages when a pool's `pool_timeout` >
`maxWait`. Prod is fine (`DATABASE_POOL_TIMEOUT=60` >> 10). Do not set
any writer pool's `pool_timeout` at or under `maxWait`, or saturation
failures flip from retryable P2028 to non-retryable P2024 and the retry
silently stops helping.
### Rollback
Env flip (set inert) or revert. Retry only fires where no SQL ran, and
the per-pool token bucket caps a storm. No migration.
refs TRI-13295, TRI-12982, TRI-12984
<!-- ccr-slack-attribution -->
_Requested by **Matt Aitken** · [Slack
thread](https://triggerdotdev.slack.com/archives/C045W9WM3E1/p1786732623292829?thread_ts=1786732623.292829&cid=C045W9WM3E1)_
**Before:** you pause an environment, then a deploy lands (or a
background worker is created, or an admin changes the
concurrency/burst-factor). The environment starts picking up runs again
even though the dashboard still shows it as paused.
**After:** a paused environment stays paused until it is resumed, no
matter what else pushes its concurrency limit.
Pausing an environment sets `paused` in the database and writes a `0`
env concurrency limit into the run queue — the `0` is the only thing
that actually stops dequeueing. Any caller that pushed the limit without
an explicit value (`finalizeDeployment`, `createBackgroundWorker`, the
two admin environment routes) rewrote the real limit and silently
un-paused the environment.
## ✅ Checklist
- [x] I have followed every step in the [contributing
guide](https://github.com/triggerdotdev/trigger.dev/blob/main/CONTRIBUTING.md)
- [x] The PR title follows the convention.
- [x] I ran and tested the code works
---
## Testing
`apps/webapp/test/pauseEnvironment.server.test.ts` gains two
`containerTest` cases that wire a real `RunEngine` (real Redis) in place
of the stubbed app singleton and assert the actual run-queue env limit:
- pause a PRODUCTION env → limit is `0` → run the real
`FinalizeDeploymentService` → limit is still `0`, plus a control on a
running env in the same test proving that deploy path really does push
the limit (so the `0` can't just mean "nothing happened").
- pause → resume → the real limit is restored, so the clamp can't
regress resuming.
Both cases fail on `main` (`expected 17 to be +0` and `expected +0 to be
17`) and pass with this change. `pnpm run typecheck --filter webapp` is
clean.
---
## Changelog
Fix paused environments starting to run work again after a deploy.
---
## How
The clamp lives in the shared `updateEnvConcurrencyLimits` helper in
`apps/webapp/app/v3/runQueue.server.ts`, so every present and future
caller is covered: when no explicit limit is passed and the environment
is paused, `0` is written instead of the stored maximum. An
explicitly-passed limit still wins, which is what pausing itself relies
on. The resume path now passes the post-update environment state (its
in-memory copy was read before the un-pause and would otherwise be
clamped back to `0`), and the helper no longer mutates the caller's
environment object — that aliasing made a pause followed by a resume on
the same object write `0` twice. The existing `!paused` guards in
`allocateConcurrency` and the queue-level guard in
`createBackgroundWorker` are left in place as defence in depth, and
queue-level `TaskQueue.paused` behaviour is untouched.
---------
Co-authored-by: Claude <noreply@anthropic.com>
## Summary
After a deployment promotion or rollback, newly triggered runs could
keep dispatching onto the previously deployed version for up to 30
seconds. Runs now resolve the current version fresh on every dequeue, so
a promotion or rollback takes effect immediately.
## Fix
The dequeue path resolved the worker version through a 30s in-process
cache that nothing invalidated on promotion, and it loaded the worker's
entire task and queue set only to keep the single row matching the run.
Both go away: the resolve now fetches just the matched task and queue by
unique index and reads them fresh, so there is no cache left to serve a
stale version.
```
- cache.get(env:current) # 30s TTL, never invalidated -> stale
- worker + ALL tasks + ALL queues
+ worker + one task WHERE slug=... + one queue WHERE id/name=... # fresh
```
A kill-switch env var (`RUN_OPS_WORKER_VERSION_FRESH_READ_ENABLED`,
default on) falls back to the old cached path without a code deploy.
Verified end-to-end on an isolated stack: a run triggered after a
mid-stream promotion now dequeues onto the new version, with the
previous stale behavior reproduced first.
## Summary
When resolving the current worker for a development environment,
`findCurrentWorkerFromEnvironment` loaded the entire `BackgroundWorker`
row,
including the large `metadata` JSON, even though it only ever returns a
handful
of small fields. It is a frequently-run query, so the wasted payload
adds up:
every call pulled data it immediately threw away.
## Fix
Add a `select` to the development-environment lookup listing exactly the
fields
the function returns (`id`, `friendlyId`, `version`, `sdkVersion`,
`cliVersion`,
`supportsLazyAttempts`, `engine`). The query plan is unchanged, still a
single-row indexed lookup; only the row width shrinks. No behavior
change: the
dropped columns were never read.
## Summary
The worker-version resolve path fetched every column of every
`BackgroundWorkerTask` for a worker (`include: { tasks: true }`), plus
full `WorkerDeployment` and `TaskQueue` rows, just to match one task at
dequeue. That pulls large JSON columns none of this path reads (task
`payloadSchema`/`config`/`queueConfig`/`description`, deployment
`externalBuildData`/`buildServerMetadata`/`errorData`/`git`, queue
`rateLimit`), so each resolve transfers and deserializes far more than
it uses.
## Fix
Replace the includes with explicit `select`s of only the columns dequeue
reads, in both the passthrough resolver and the app resolver:
- task: `id`, `slug`, `machineConfig`, `retryConfig`,
`maxDurationInSeconds`
- deployment: `id`, `friendlyId`, `imageReference`, `imagePlatform`
- queue: `id`, `name` (the queue matcher keys on both)
The shared `ResolvedWorkerVersion` element types narrow to match
(mirrored in the cache), which also shrinks each cached worker-version
entry.
## Impact
The `tasks` read fetches every task of a worker to match one, so its
cost scales with task count and payload-schema size. For a worker with
~70 registered tasks, dropping the unread columns cuts the per-query
transfer roughly:
| Task shape | Before | After | Reduction |
|---|---|---|---|
| Light (no payload schema, small config) | ~28 KB | ~14 KB | ~54% |
| Typical (mixed schemas / config) | ~62 KB | ~14 KB | ~77% |
| Schema-heavy (large `payloadSchema`) | ~200 KB | ~14 KB | ~93% |
The `after` size is roughly fixed because the kept columns are small;
the win grows with how heavy the dropped JSON is. Narrowing `deployment`
(four JSON columns off a single row) and `queues` saves further on top.
No behavior change: pure read-shape narrowing, no flag and no schema
change, so rollback is a plain revert. Verified with a red/green
run-engine test that asserts the resolved task, deployment, and queue
carry only the used columns, plus the queue feature-matrix runs (batch,
retry-policy, machine-preset, plain trigger) that exercise the kept
columns.
## What
A relation with `onDelete: Cascade | SetNull` whose child FK column has
no index makes every parent delete fire a cascade that sequentially
scans the whole child table. That has shipped three times recently and
had to be fixed after the fact (#4554 `ProjectAlert.channelId`, #4555
`EnvironmentVariableValue.valueReferenceId`, #4588
`PersonalAccessToken.userId`).
This adds a schema-aware CI guard that catches the next one before it
merges.
## How
`apps/webapp/scripts/fkCascadeIndexGuard.ts` parses both Prisma schemas
(`@trigger.dev/database`, `@internal/run-ops-database`) and flags any
`onDelete: Cascade | SetNull` relation whose leading FK scalar is not
the leading column of some index (`@@index` / `@@unique` / `@@id` /
field-level `@id`/`@unique`) on the child model. A leading FK column
lets the cascade's `WHERE fk = $1` use the index instead of a seq scan.
It is modeled on the existing `runOpsLegacyGuard` (same `--check` gate,
same baseline-regenerate pattern), and it is lighter: it only reads
`schema.prisma` as text, so its CI job needs no Prisma client generation
and no raised heap.
## Why a baseline, not a hard rule
Not every unindexed cascade FK is a live bug. When the parent is only
ever soft-deleted, the cascade never fires, so the missing index is
harmless. Hard vs soft delete lives in application code
(`parent.delete()` vs `parent.update({ deletedAt })`), not in the
schema, and a `deletedAt` column proves neither direction. So the guard
makes no such judgment: it flags every unindexed cascade FK uniformly
and carries a baseline of the 72 currently-accepted cases. Only
violations **not** in the baseline fail `--check`.
The value is the forcing function: a newly added cascade FK stops CI and
makes the author answer "is the parent ever hard-deleted?" Add the index
if yes; regenerate the baseline with a reason if no.
## Wiring
- `apps/webapp/package.json`: `guard:fk-cascade-index` script
(regenerate with no args, gate with `-- --check`).
- `.github/workflows/fk-cascade-guard.yml`: the reusable workflow.
- `.github/workflows/pr_checks.yml`: runs on webapp-affecting changes,
aggregated into `all-checks`.
## Verification
- The three already-fixed columns are correctly seen as indexed (absent
from the baseline).
- `--check` passes on the current schemas (72 baselined, 0 new).
- A synthetic new unindexed cascade FK fails with exit 1 and an
actionable message.
- Adding `@@index([fk])`, or a composite leading with the FK, clears it.
No false positives.
- `oxfmt` and `oxlint` clean on the new script.
## Rollback
Pure tooling addition, no runtime code, no schema or data change. Revert
to remove.
## Summary
Clarifies when to add a changeset or a `.server-changes/` file. The
friction that keeps coming up is treating these as "I touched a public
package or a server app, so I owe a note." They are user-facing release
notes that go straight into the changelog customers read, not a catalog
of every change.
The guidance now leads with the real test: would a user or customer care
about this change? Add a note when the change is something they would
notice, act on, or want to hear about. Skip it otherwise, even when a
public package or server app is touched, for example:
- internal-only or admin-only changes, refactors, test-only changes,
chores
- performance or query tuning with no user-visible behavior change
- public packages that are not consumed independently (e.g.
`@trigger.dev/redis-worker`), where a version bump means nothing to a
user
Anyone who wants the exact history reads the commits.
Updates every place that encoded the old "touched a package or app, so
add a note" rule so they agree: `AGENTS.md`,
`.server-changes/README.md`, `CONTRIBUTING.md`, `CHANGESETS.md`,
`.claude/rules/server-apps.md`, and `.claude/REVIEW.md` (the last drives
automated review flagging, so it stops flagging exactly the changes the
new guidance says to skip). Also handles the mixed-PR case where the
package change needs no changeset but the server change is user-facing.
## Summary
The notifications admin list loaded every interaction row for the
notifications on the current page just to show three per-notification
counters (seen, clicked, dismissed), then counted them in memory. On
notifications with many interactions this made the page slow to load and
heavy on memory, even though only 20 notifications are shown.
## Fix
Compute the counters in a single grouped aggregate in the database
instead, returning one row per notification rather than one row per
interaction:
```sql
SELECT "notificationId",
COUNT(*) AS seen,
COUNT(*) FILTER (WHERE "webappClickedAt" IS NOT NULL) AS clicked,
COUNT(*) FILTER (WHERE "webappDismissedAt" IS NOT NULL OR "cliDismissedAt" IS NOT NULL) AS dismissed
FROM "PlatformNotificationInteraction"
WHERE "notificationId" IN (...)
GROUP BY "notificationId"
```
Behavior is unchanged; notifications with no interactions report zero.
The generated deploy Containerfile now starts from the prebuilt base
images published by base-images/ (`triggerdotdev/node` and
`triggerdotdev/bun` on DockerHub, pinned by digest) instead of
installing system packages during every project's build. Uncustomized
projects run no apt at all and their base layers are identical across
every project, so worker nodes cache one copy fleet-wide. The build
stage uses the -build toolchain variant for uncustomized and
package-only projects; projects with image instructions build FROM base
so instructions and their downloads run exactly once.
### Notes
- User packages install in their own sorted RUN with --allow-downgrades
(a pin of a preinstalled package is a downgrade against the prebuilt
base), preceded by a dpkg repair whenever instructions came first, since
apt-get install refuses to run on state a dpkg -i instruction left
broken.
- Deployed runtime images inherit newer package versions than today's
live-archive installs (the published bases upgrade everything to their
snapshot), plus the base images' OCI labels. Runtime env, user, workdir,
and entrypoint are unchanged.
## Summary
Since the move from the Remix compiler to Vite
([#4188](https://github.com/triggerdotdev/trigger.dev/pull/4188)), the
"App version" on the organization settings page shows `v0.0.0` unless
the image was built from a semver release tag (which bakes in
`BUILD_APP_VERSION`). Self-hosted builds and any image built from `main`
are affected. This restores the real version.
## Root cause
The Vite SSR bundle resolves workspace packages to TS source via the
`@triggerdotdev/source` condition, so `@trigger.dev/core`'s `VERSION`
constant is bundled as its raw `"0.0.0"` placeholder.
`scripts/updateVersion.ts` still stamps the real version at build time,
but only into the packages' dist output, which the bundle no longer
reads. The old Remix compiler bundled the stamped dist, which is why
this used to work.
The fix is a small Vite plugin that applies the same substitution to the
source version modules of `@trigger.dev/core` and `@trigger.dev/sdk`
during bundling. Beyond the settings page, this also restores real
values in the `trigger-version` request header and the version
attributes the bundled packages emit.
Verified by building the server bundle and confirming the VERSION
constants carry the package versions, with no `"0.0.0"` occurrences left
in the build output.
## Summary
Adds execution-window product surfaces for both declarative and
imperative schedules.
- Declarative schedules can set `window` through `schedules.task()`,
with support for whole-minute, hour, and percentage values.
- Imperative schedules can create, update, clear, and inspect windows
through the API and dashboard.
- Schedule API responses preserve `nextRun` as the nominal CRON time and
expose `nextRunEffectiveAt` as the stable assigned time.
- The dashboard displays configured windows alongside assigned
upcoming-run times.
- Deploy output summarizes declarative schedules and suggests adding a
wider window when the default 60-second placement range is used.
## Design
Window validation remains authoritative on the server and ensures each
window is compatible with the schedule cadence. Omitting a window uses
the default 60-second range, while explicit zero-duration windows remain
supported.
Deployment summaries are derived from the deployment's stored task
metadata, so they reflect the declarations associated with that
deployment.
## Summary
Projects that configure their own `metricExporters` or `metricReaders`
in `trigger.config.ts` were losing task metrics on nearly every run, and
seeing an unexplained `Failed to flush tracingSDK` alongside
`OTLPExporterError: Bad Request` in their run logs. Spans and logs kept
working, so the runs otherwise looked healthy.
## Root cause and fix
Every configured exporter gets its own `PeriodicExportingMetricReader`,
and `meterProvider.forceFlush()` fans out across all readers with
`Promise.all`, so two collections can land on the same millisecond.
`@opentelemetry/host-metrics` divides by the elapsed interval to compute
`process.cpu.utilization`
([common.ts](https://github.com/open-telemetry/opentelemetry-js-contrib/blob/main/packages/host-metrics/src/stats/common.ts)),
so a zero interval yields `0/0`. `JSON.stringify(NaN)` is `null`, and a
collector rejects `"asDouble": null` with a 400 that drops the
**entire** request, not just the offending point.
`flush()` and `shutdown()` now walk the metric readers one at a time, so
collections can no longer share a timestamp. Each reader is isolated, so
one failing reader cannot skip the readers behind it, and every failure
is logged with the reader that produced it. The first error is still
rethrown, so callers see failures exactly as before.
As a second layer, non-finite data points are dropped just before our
own export, so a metric that divides by zero cannot take the rest of the
batch with it. Exporters and readers supplied through
`trigger.config.ts` are untouched by that filter and still receive raw
data.
The trade-off is that configured exporters now flush after the built-in
one rather than alongside it, so flush latency is the sum rather than
the max.
An internal test package's dependency on core was replaced with a local
helper, because core now needs that package in `devDependencies` and the
two together formed a workspace cycle.
## Verification
Tested against a real collector in a container: a batch containing a
`NaN` reading is rejected with a 400 without the fix and accepted with
it, and a single flush is asserted to collect from one reader at a time.
## Summary
Fair queue consumers could leak the per-tenant concurrency slots that
gate admission. Slots were freed on some paths and skipped on others,
and once enough leaked slots accumulated for a tenant, every queue that
tenant owned stopped being served until someone cleared the set by hand.
This PR frees slots on every path and, more importantly, makes the
remaining failure modes self-healing.
## Design
The fix applies one rule uniformly: releasing a concurrency slot is
best-effort cleanup and must never block the message's primary state
transition. Blocking completion re-delivers the message, which
duplicates customer work; blocking a retry loses the attempt increment,
so the message can circle forever; blocking a reclaim strands the
message in flight. A leaked slot is the better failure in every one of
those trades because it is the only one that is recoverable. A failed
release is therefore logged and the transition proceeds.
Leaked slots then heal through two mechanisms:
- `reserve` re-admits a message that is already a member of its own
concurrency set, since re-admitting it does not increase concurrency. A
message whose earlier release failed can no longer be blocked by its own
leftover slot.
- A reconcile loop periodically removes any set member with no in-flight
record (interval configurable via `reconcileIntervalMs`, default 60s).
The check-and-remove is atomic, and it is sound because a message is
always registered in flight before its slot is reserved, so a member
with no in-flight record can only be a leak. This also covers leaks this
PR cannot prevent directly, such as a release that resolves the wrong
concurrency group from queue metadata.
Ordering hardening from earlier revisions stays: slots are released
before the in-flight record needed to describe them is discarded, the
release Lua scripts write the message back to the queue before removing
it from in-flight (Lua does not roll back on error), and dangling
in-flight entries with no payload are dropped instead of being rescanned
forever.
Every guard test was verified to fail without its specific fix,
including the duplicate-execution case: completing a message while its
slot release fails used to re-deliver and re-execute it.
Every publish now also pushes an immutable per-publish tag alongside the
mutable one, named after the snapshot date and commit (e.g.
`22-bookworm-20260812-45444a7`), so previously published digests stay
tag-referenced after republishes. Shipped CLI releases pin those
digests, so they must remain resolvable indefinitely.
Merging triggers a republish; the fresh tag-protected digests will then
be pinned by #4602 before it merges.
## Summary
Follow-up to #4595. Dashboard pages under an environment loaded every
environment in the project on each page just to resolve the one named in
the URL. On projects with many preview branches that meant reading
hundreds of (mostly archived) rows on every page load.
## Fix
The environment-scoped layout loader now scopes its lookup to the slug
in the URL (`where: { slug: envParam }`), resolving the current
environment through the `projectId, slug` composite index instead of
loading the whole project. Archived branches stay viewable by slug.
`BatchListPresenter` is bounded to the current environment, since every
batch in that list already belongs to it.
Verified on a project seeded with 2,000 archived branch environments:
the layout lookup drops from all environments to one, and both a normal
environment page and an archived branch page render correctly.
## Summary
4 new features, 24 improvements, 10 bug fixes.
## Highlights
- Allow `trigger deploy` to authenticate with an environment API key
from `TRIGGER_ACCESS_TOKEN`.
([#4561](https://github.com/triggerdotdev/trigger.dev/pull/4561))
## Improvements
- Chat in the browser now reconnects when the connection drops mid-turn,
instead of leaving the reply stuck as if it were still generating.
Reports can be fetched as structured data with the `json` format, and
the shortest report period is now one minute (`1m`, `30m`, `1h`, `7d`).
The `mint-token` command's help is clearer too: a token minted without
`--cap` is read-only, and `--ttl` shows the correct maximum lifetime of
7 days.
([#4418](https://github.com/triggerdotdev/trigger.dev/pull/4418))
- The dev environment onboarding now tracks real progress. After you run
`init`, the setup checklist marks your project as initialized, and it
updates live as your dev server connects and your tasks register. The
blank state also adds a "Copy AI agent prompt" button that copies a
ready-to-paste setup prompt (pre-filled with your project reference) for
Claude Code, Cursor, or any coding agent.
([#4563](https://github.com/triggerdotdev/trigger.dev/pull/4563))
The `init` scaffold now imports from `@trigger.dev/sdk` instead of the
deprecated `@trigger.dev/sdk/v3` subpath.
- Deployed images now ship dependencies and bundled task code as
separate layers. Repeat deploys with unchanged dependencies typically
push and pull far less data, making deploys and worker image pulls
faster.
([#4551](https://github.com/triggerdotdev/trigger.dev/pull/4551))
- The current-worker API now reports each task's queue, so you can see
which tasks write to a given queue.
([#4525](https://github.com/triggerdotdev/trigger.dev/pull/4525))
- Watch-mode chat streams now survive quiet windows and page reloads,
and a reply cut off by a lost connection shows an error instead of
appearing finished. Aborting a resumed subscription only closes your
local stream — call `stopGeneration(chatId)` or pass `stopOnAbort: true`
to stop the run. Also fixed a race where quickly restarting a stream
could break stop and reconnect, and stopping a chat now hands it back to
your other tabs instead of leaving them read-only.
([#4516](https://github.com/triggerdotdev/trigger.dev/pull/4516))
## Server changes
These changes affect the self-hosted Docker image and Trigger.dev Cloud:
- The dashboard agent now has a monthly message allowance and plan-based
limits on watches. Queries stay read-only with clearer errors when busy,
and messages with unusual characters no longer fail to send.
([#4516](https://github.com/triggerdotdev/trigger.dev/pull/4516))
- Meet the dashboard agent: a chat in every environment that answers
questions about your runs, queues, errors and health with real data and
links, replacing Ask AI everywhere it used to appear. Investigate a
failed run, an error, a backed-up queue or a run that hasn't started to
get a worked-through answer — what happened, why, and how to fix it,
with every claim linked to the runs, errors and deploys behind it. It
reads your data read-only, works on preview and dev branches with that
branch's own data, and reads the same everywhere — dashboard, terminal,
editor. A very long chat keeps working: the agent summarises the earlier
part and carries on.
**Watch…** on a run, queue, error or the health report tells you when
things change: a run finishes, a queue clears or grows past a number you
pick, an error comes back, an environment recovers. The answer arrives
in the chat and, if you want, by email, Slack or webhook — and the agent
can look into bad news on its own. A watch reaches you on any browser
you sign in from, without opening the chat first.
A sample of conversations is scored automatically so the agent keeps
getting better; only the score and a one-line summary are kept, never
your messages, data or code, and we can switch it off for your
organization on request. Ask the agent instead of the Docs buttons in
page headers — they stay there when the agent isn't available to you.
Separately, a queue's wait times, peak depth, throughput and throttling
can now be read from the API.
([#4418](https://github.com/triggerdotdev/trigger.dev/pull/4418))
- Add backend support for delaying cron schedules within a specified
window with a minimum of 60 seconds.
([#4566](https://github.com/triggerdotdev/trigger.dev/pull/4566))
- Reduced recurring background database load from the billing-limit
recovery check, so paused environments are reconciled with less
overhead.
([#4590](https://github.com/triggerdotdev/trigger.dev/pull/4590))
- Validating a schedule when deploying or updating a schedule now does
less work on projects with many preview branches, so those operations
stay fast as branches accumulate.
([#4598](https://github.com/triggerdotdev/trigger.dev/pull/4598))
- Project pages now load faster for projects with a large number of
preview branches, by no longer loading archived branch environments that
aren't shown.
([#4595](https://github.com/triggerdotdev/trigger.dev/pull/4595))
- Database queries that filter on a list of values now reuse cached
query plans more consistently, instead of forcing the database to
re-plan whenever the list length changes.
([#4480](https://github.com/triggerdotdev/trigger.dev/pull/4480))
- Routine cleanup of old dashboard agent data now runs on its own
schedule.
([#4599](https://github.com/triggerdotdev/trigger.dev/pull/4599))
- Database connection metrics are now reported for every configured
database connection instead of only the primary one, and stay accurate
regardless of connection type.
([#4541](https://github.com/triggerdotdev/trigger.dev/pull/4541))
- Deployment-related API endpoints now draw from their own generous rate
limit budget, configurable via the `DEPLOYMENT_RATE_LIMIT_*` environment
variables, so runtime API traffic no longer competes with deployments
for the same per-environment budget.
([#4565](https://github.com/triggerdotdev/trigger.dev/pull/4565))
- Deleting or editing a secret environment variable is now fast and no
longer slows down as a project accumulates variables.
([#4555](https://github.com/triggerdotdev/trigger.dev/pull/4555))
- Speed up personal access token lookups by indexing them on their owner
([#4588](https://github.com/triggerdotdev/trigger.dev/pull/4588))
- Switching project or organization in the sidebar now keeps you on the
same page instead of sending you back to Tasks. Pages for a specific
run, deploy or other single item open the matching list instead.
([#4585](https://github.com/triggerdotdev/trigger.dev/pull/4585))
- Reduced database load when loading the dashboard by removing an unused
organization member count that was being calculated on every page
navigation.
([#4587](https://github.com/triggerdotdev/trigger.dev/pull/4587))
- The environment variables page now loads a page at a time, keeping it
fast for projects with a large number of variables. Search matches
variable names across every page.
([#4597](https://github.com/triggerdotdev/trigger.dev/pull/4597))
- Groundwork for an alternative database connection driver, gated behind
configuration and disabled by default, so there is no change to default
behavior.
([#4539](https://github.com/triggerdotdev/trigger.dev/pull/4539))
- Deleting an alert channel is now fast and no longer slows down as a
project builds up alert history.
([#4554](https://github.com/triggerdotdev/trigger.dev/pull/4554))
- Reduced internal overhead on the API under high load.
([#4532](https://github.com/triggerdotdev/trigger.dev/pull/4532))
- Out-of-date upgrade prompts no longer appear in the dashboard: the
"V4" badges and the notices saying preview branches and the queues table
need V4 have been removed. The side menu still warns you when a project
is on v3, with updated wording and a link to the v4 upgrade guide.
([#4589](https://github.com/triggerdotdev/trigger.dev/pull/4589))
- Make background worker registration cheaper for projects with many
scheduled tasks by scoping declarative schedule reconciliation to the
current environment and dropping redundant schedule lookups.
([#4577](https://github.com/triggerdotdev/trigger.dev/pull/4577))
- Speed up setting and importing environment variables for projects with
many variables.
([#4579](https://github.com/triggerdotdev/trigger.dev/pull/4579))
- Loading the deployments list is now faster, especially when filtering
by deployment status on projects with many deployments.
([#4591](https://github.com/triggerdotdev/trigger.dev/pull/4591))
- Fixed the billing limits page timing out for organizations with many
preview branches, especially while a spend limit was being enforced. The
page now loads quickly, so you can raise or resolve your limit without
delay. ([#4594](https://github.com/triggerdotdev/trigger.dev/pull/4594))
- Fix the Concurrency page showing the plan's default concurrency for
the dev environment instead of the environment's actual limit.
([#4596](https://github.com/triggerdotdev/trigger.dev/pull/4596))
- Creating an organization sometimes left you back on the creation form
even though the organization had already been created, so clicking
Create again made a duplicate. Creating an organization now completes
and takes you to your new organization.
([#4530](https://github.com/triggerdotdev/trigger.dev/pull/4530))
- Ensure creating a project completes instead of returning to its
creation form after a navigation error.
([#4584](https://github.com/triggerdotdev/trigger.dev/pull/4584))
- Renaming a project now keeps you on the project settings page and
tells you what happened, instead of silently moving you to the tasks
page or clearing the form with no explanation.
([#4601](https://github.com/triggerdotdev/trigger.dev/pull/4601))
- Fixed support threads showing no account details for some customers,
so the team can see your plan, organizations and projects when you get
in touch.
([#4575](https://github.com/triggerdotdev/trigger.dev/pull/4575))
- In the light theme, the Format, Clear and Copy buttons on the query
editor no longer blend into the query text behind them.
([#4592](https://github.com/triggerdotdev/trigger.dev/pull/4592))
- The health report now says start latency is "unknown" when there is no
data for it, instead of showing a healthy-looking 0ms
([#4544](https://github.com/triggerdotdev/trigger.dev/pull/4544))
- Realtime streams written inside a chat session run now use the same
backend as the session itself, and runs are no longer created against a
backend that cannot serve them.
([#4564](https://github.com/triggerdotdev/trigger.dev/pull/4564))
- The grouped "watch updates" notification now shows the total number of
results waiting, instead of only the most recent batch's count.
([#4525](https://github.com/triggerdotdev/trigger.dev/pull/4525))
<details>
<summary>Raw changeset output</summary>
# Releases
## @trigger.dev/build@4.5.11
### Patch Changes
- Updated dependencies:
- `@trigger.dev/core@4.5.11`
## trigger.dev@4.5.11
### Patch Changes
- Chat in the browser now reconnects when the connection drops mid-turn,
instead of leaving the reply stuck as if it were still generating.
Reports can be fetched as structured data with the `json` format, and
the shortest report period is now one minute (`1m`, `30m`, `1h`, `7d`).
The `mint-token` command's help is clearer too: a token minted without
`--cap` is read-only, and `--ttl` shows the correct maximum lifetime of
7 days.
([#4418](https://github.com/triggerdotdev/trigger.dev/pull/4418))
- Allow `trigger deploy` to authenticate with an environment API key
from `TRIGGER_ACCESS_TOKEN`.
([#4561](https://github.com/triggerdotdev/trigger.dev/pull/4561))
- The dev environment onboarding now tracks real progress. After you run
`init`, the setup checklist marks your project as initialized, and it
updates live as your dev server connects and your tasks register. The
blank state also adds a "Copy AI agent prompt" button that copies a
ready-to-paste setup prompt (pre-filled with your project reference) for
Claude Code, Cursor, or any coding agent.
([#4563](https://github.com/triggerdotdev/trigger.dev/pull/4563))
The `init` scaffold now imports from `@trigger.dev/sdk` instead of the
deprecated `@trigger.dev/sdk/v3` subpath.
- Deployed images now ship dependencies and bundled task code as
separate layers. Repeat deploys with unchanged dependencies typically
push and pull far less data, making deploys and worker image pulls
faster.
([#4551](https://github.com/triggerdotdev/trigger.dev/pull/4551))
- Updated dependencies:
- `@trigger.dev/core@4.5.11`
- `@trigger.dev/build@4.5.11`
- `@trigger.dev/schema-to-json@4.5.11`
## @trigger.dev/core@4.5.11
### Patch Changes
- Chat in the browser now reconnects when the connection drops mid-turn,
instead of leaving the reply stuck as if it were still generating.
Reports can be fetched as structured data with the `json` format, and
the shortest report period is now one minute (`1m`, `30m`, `1h`, `7d`).
The `mint-token` command's help is clearer too: a token minted without
`--cap` is read-only, and `--ttl` shows the correct maximum lifetime of
7 days.
([#4418](https://github.com/triggerdotdev/trigger.dev/pull/4418))
- The current-worker API now reports each task's queue, so you can see
which tasks write to a given queue.
([#4525](https://github.com/triggerdotdev/trigger.dev/pull/4525))
## @trigger.dev/python@4.5.11
### Patch Changes
- Updated dependencies:
- `@trigger.dev/core@4.5.11`
- `@trigger.dev/sdk@4.5.11`
- `@trigger.dev/build@4.5.11`
## @trigger.dev/react-hooks@4.5.11
### Patch Changes
- Updated dependencies:
- `@trigger.dev/core@4.5.11`
## @trigger.dev/redis-worker@4.5.11
### Patch Changes
- Updated dependencies:
- `@trigger.dev/core@4.5.11`
## @trigger.dev/rsc@4.5.11
### Patch Changes
- Updated dependencies:
- `@trigger.dev/core@4.5.11`
## @trigger.dev/schema-to-json@4.5.11
### Patch Changes
- Updated dependencies:
- `@trigger.dev/core@4.5.11`
## @trigger.dev/sdk@4.5.11
### Patch Changes
- Chat in the browser now reconnects when the connection drops mid-turn,
instead of leaving the reply stuck as if it were still generating.
Reports can be fetched as structured data with the `json` format, and
the shortest report period is now one minute (`1m`, `30m`, `1h`, `7d`).
The `mint-token` command's help is clearer too: a token minted without
`--cap` is read-only, and `--ttl` shows the correct maximum lifetime of
7 days.
([#4418](https://github.com/triggerdotdev/trigger.dev/pull/4418))
- Watch-mode chat streams now survive quiet windows and page reloads,
and a reply cut off by a lost connection shows an error instead of
appearing finished. Aborting a resumed subscription only closes your
local stream — call `stopGeneration(chatId)` or pass `stopOnAbort: true`
to stop the run. Also fixed a race where quickly restarting a stream
could break stop and reconnect, and stopping a chat now hands it back to
your other tabs instead of leaving them read-only.
([#4516](https://github.com/triggerdotdev/trigger.dev/pull/4516))
- Updated dependencies:
- `@trigger.dev/core@4.5.11`
</details>
Co-authored-by: github-actions[bot] <41898282+github-actions[bot]@users.noreply.github.com>
## Summary
On the Concurrency page, the dev environment row's Total always showed
the plan's included dev concurrency, even when the environment's limit
had been raised. The row's own "Extra concurrency" value was already
derived from the real limit, so the two columns could disagree with each
other.
## Root cause
The Total cell renders `planConcurrencyLimit + allocation`, where
`allocation` is the state behind the editable prod/staging inputs. Dev
environments are deliberately excluded from that allocation map (dev
concurrency is not purchasable), so the dev row's allocation always
resolved to 0 and the Total fell back to the plan value. The dev row now
renders the environment's actual `maximumConcurrencyLimit` instead.
## What & why
Org avatars disappeared from the sidebar, replaced by alt text spilling
across it. Two bugs stacked: the document img-src CSP pins the Google
favicon endpoint org avatars are stored as, but Google 302-redirects it
to `tN.gstatic.com` and CSP re-checks the redirect target, so the avatar
is refused. Changelog images served from `trigger.dev` in the agent chat
were also missing from the allowlist. And `Avatar.tsx` had no clipping
and no error fallback, so a refused image degraded into overflowing alt
text.
## What's inside
**CSP allowlist** — `app/utils/cspImageOrigins.ts`: the base sources
gain the four gstatic shards `t0`–`t3.gstatic.com`, path-pinned to
`/faviconV2`, plus `https://trigger.dev/changelog/` as a path prefix. No
wildcards — the no-wildcard beacon policy stands. The shard hosts are
Google-operated with no public write path, so the enumeration is as
narrow as the existing `s2/favicons` entry; if Google ever adds a `t4`,
the failure mode is one broken avatar, not a broken page.
**Avatar fallback** — `app/components/primitives/Avatar.tsx`: the image
box clips, and a failed load falls back to the globe icon. That covers
failures before hydration too — `onError` never replays for a node that
already failed, so a ref checks `complete && naturalWidth === 0` at
attach time. The error state resets when the URL changes
(`key={avatar.url}`).
**Radio card theming** — `app/components/primitives/RadioButton.tsx`: in
the dark themes the checked radio card rendered darker than the
unchecked ones. Unchecked cards now sit on `background-bright`
(near-black in dark, unchanged white in light) and the checked card uses
the `surface-control` tokens, so selection reads black → grey in dark
themes; light theme keeps its current look. The API keys route keeps its
indigo checked-hover via an explicit override.
## Testing
The CSP test helper now implements CSP's real path-matching rule
(trailing slash = prefix, otherwise exact, query ignored) and asserts
the pins hold: the gstatic redirect target passes, `beacon.png` on
gstatic, a `t9` shard, and non-changelog `trigger.dev` paths stay
blocked. 39 tests green plus webapp typecheck. Verified against a
running webapp that the served directive contains the new sources.
## What & why
The dashboard agent's upkeep — retention deletes and the investigation
sweep — ran as cron jobs on the webapp's common worker, even though it
only touches the agent's own datastore. This moves that upkeep into the
agent's Trigger project as scheduled tasks (TRI-13182).
## What's inside
**Retention** — `internal-packages/dashboard-agent/src/maintenance.ts`,
a daily task (03:00 UTC). Deletes turn evals older than 30 days,
hard-deletes chats soft-deleted more than 30 days ago, and purges
terminal watches and submission rows older than 7 days. It used to run
every 5 minutes; nothing needs a hard delete that fast, so it is daily
now, draining in bounded batches and warning if it hits the cap. It
retries (3 attempts) because the next run is a day away. It connects
with `DASHBOARD_AGENT_DATABASE_URL`, falling back to `DATABASE_URL` like
every other task in the package (the deletes are confined to the agent's
own Postgres schema), and skips when neither is set.
**Investigation sweep** — `src/investigation-sweep.ts`, every 5 minutes,
same as before: settles investigation cards stuck `in_progress`
(30-minute window, attempt cap, force-abandon note). It keeps the fast
cadence because it fixes live state the UI is showing.
**What stays in the webapp.** The watch finalize/deliver sweep and batch
rearm: they cover a dead agent-side tick chain — a backstop can't live
inside the thing it backstops — and they need the main database and the
alerts worker. The org-deletion chat purge also stays: deletion must not
depend on the agent project being deployed. The removed cron job keeps a
cron-less tombstone entry so already-queued items drain cleanly; remove
it in a follow-up.
**Test plumbing** — the drizzle migration replayer that webapp tests
hand-rolled is now exported once from
`@internal/dashboard-agent-db/testing`; the moved tests live in the
agent package as `src/*.test.ts` against real Postgres.
## Testing
Agent package: retention passes (backlog drain, batch cap, no-op guard,
chat-delete cascade) and the sweep, on testcontainers Postgres. Webapp:
the watch/chat suites, plus a test that a settlement card stops the
dashboard spinner. Full typecheck on both.
Publishes the base images deployed task containers will build on:
`triggerdotdev/node:{21,22,24,26}-bookworm` and
`triggerdotdev/bun:1.3-node20-bookworm`, each with a `-build` toolchain
variant, multi-arch, built from a pinned Debian snapshot so every
published layer is reproducible from recorded inputs and carries a
GitHub provenance attestation.
Publishing runs on manual dispatch and on merges touching
`base-images/`. Pull requests build without pushing.
## What
`CheckScheduleService.call` loaded **every** environment of a project
(`{ id, type, archivedAt }`, no filter) and then immediately narrowed to
just the requested `environmentIds` via
`resolveProjectScopedEnvironments`. It only ever uses the requested envs
(to reject foreign env ids and reject archived branches). On a
preview-heavy project that meant loading hundreds of archived branch
rows to validate one, on a path called in a per-scheduled-task loop on
the deploy path (`createBackgroundWorker` -> `syncDeclarativeSchedules`)
and from `upsertTaskSchedule`.
The query is index-backed and individually fast (rows_read/returned = 1
per predicate), so this is about result-set width / egress and wasted
work at scale (~580k calls/24h observed via Insights), not a slow plan.
## Change
Bound the `environments` relation load to `boundedIn(environmentIds)`:
```ts
environments: {
where: { id: { in: boundedIn(environmentIds) } },
select: { id: true, type: true, archivedAt: true },
}
```
Returns `<=` the number of requested envs (usually 1) instead of the
whole project. Both existing behaviors are preserved:
- **Foreign-id rejection**: the relation is still scoped to the project,
so a requested id belonging to another project never comes back and
`resolveProjectScopedEnvironments` reports it as `foreign` (a missing
requested id is already treated as foreign).
- **Archived-branch rejection**: a requested id that is an archived
branch still comes back with `archivedAt` set, so the downstream `Can't
add or edit a schedule for an archived branch` check still fires.
`archivedAt` is kept in the select deliberately, so this bounds by id
rather than filtering archived rows out.
## Evidence (isolated stack, seeded 1 prod env + 40 archived branch
envs)
Local `EXPLAIN (ANALYZE)` of the exact environments sub-select:
| | rows returned | buffers |
|---|---|---|
| before (unbounded) | **41** | shared hit=12 |
| after (`id IN (requested)`) | **1** (`Rows Removed by Filter: 40`) |
shared hit=4 |
Same `RuntimeEnvironment_projectId_idx`, no plan change. Rows to the
client drop to `len(environmentIds)`, which is the point.
**Unit (vitest, testcontainers, real Postgres):**
`apps/webapp/test/checkSchedule.test.ts` extended to prove, on real
rows, that the bounded load returns only the requested env (1 of 10),
still reports a foreign id as foreign, and still surfaces an archived
branch when it is the requested one. 5/5 pass.
**Full e2e (both execution modes, real stack):** a purpose-built project
with two declarative `schedules.task`s.
- `trigger dev`: dev worker created, both schedules synced through the
edited `checkSchedule` loop, no errors.
- `trigger deploy` (managed deployment): PRODUCTION worker registered,
both schedules synced against the **prod** environment through the same
loop, prod + dev schedule instances active, no errors.
`typecheck --filter webapp` clean.
## Rollout / rollback
Straight deploy, no flag, no migration. Rollback is revert-only
(read-path narrowing, no data change). Old and in-flight rows read
correctly under both the old and new code.
## Out of scope
The two lower-priority sibling reads in the ticket (the Query/metrics
env id->slug map and the env-var repository fan-out) are left for
follow-ups; they need caching / per-method scoping rather than this
single bound.
## What
The environment variables settings page loaded **every** variable in the
project in one shot, with a nested `values` read plus a `valueReference`
(SecretReference) sub-load that was selected but never read. For a
project with many variables this pulled `variables × environments` value
rows (~18k for large projects) on every page load, plus a matching
~18k-row `SecretReference IN` query.
This paginates the presenter by variable key and removes the dead
include.
- Remove the never-read `valueReference: { select: { key } }` include →
the `SecretReference` query is gone entirely.
- Paginate the parent variable query: `count` + `orderBy key` +
`skip/take`, page size 50 → the value read is bounded to `pageSize ×
environments` per page.
- Scope the count and the page to variables that have a value in a
displayed environment (`values: { some: { environmentId: { in } } }`),
so `totalCount`/`totalPages` and the `skip/take` window match what
actually renders (no phantom empty pages from variables that live only
in archived branches or another member's dev env).
- Display order comes from the DB `orderBy: { key: "asc" }` — the
presenter no longer re-sorts each page with `localeCompare`, which under
pagination could disagree with the DB collation at page boundaries.
- The secret-value lookup (`SecretStore` keys) and the updater lookup
(`user` by id) are now scoped to the current page instead of the whole
project.
- Search moves server-side (variable key, case-insensitive) and drives
both the count and the page; the UI gains standard pagination controls.
## Why
The two correlated ~18k-row control-plane queries flagged in the ticket
come from this settings-page presenter, not from any hot path. Both are
index-covered (`rows_read == rows_returned`); the issue is the sheer
volume fetched in one burst. Bounding it per page removes the burst.
## Evidence
Measured on an isolated stack with a seeded project of 1000 variables ×
3 environments (3000 value rows), using Prisma's emitted-SQL log:
| | SecretReference query | value rows fetched |
| --- | --- | --- |
| before | 1 | 3000 |
| after | **0** | **150** (page 1) + one `count` |
`EXPLAIN` on Prisma's verbatim statements (index confirmed via
`enable_seqscan=off`; the local table is too small for the planner to
choose them by default):
- `count` (`WHERE projectId AND EXISTS(values in displayed envs)`) →
Hash Join: Index Scan on `EnvironmentVariable_pkey` + Bitmap Index Scan
on `EnvironmentVariableValue_environmentId_idx`
- paginated parent (`WHERE projectId AND EXISTS(...) ORDER BY key
LIMIT/OFFSET`) → Nested Loop Semi Join: Index Scan on
`EnvironmentVariable_projectId_key_key` (**no Sort node**) driving an
Index-Only Scan on
`EnvironmentVariableValue_variableId_environmentId_key`
- nested values (`variableId = ANY … AND environmentId = ANY …`) → index
scan on `EnvironmentVariableValue_environmentId_idx`
- `SecretStore` keys (`key = ANY …`) → index scan on
`SecretStore_key_idx`
No new index required. Verified in the browser on the seeded project: 20
pages, page navigation, server-side search (matches across all pages),
last page renders, no app console errors. `typecheck`, `oxlint`, `oxfmt`
all clean.
## Behavior change
The previous client-side search matched variable **name and value** (and
environment type / branch name). Values are encrypted at rest and
resolved separately, so they cannot be searched server-side under
pagination. Search is now **variable-name only**, server-side,
case-insensitive. Projects with fewer than one page of variables see no
pagination bar and no visible change.
## Rollout / rollback
Pure read-path change on a dashboard loader, no schema or data
migration. Rollback is a straight revert.
## Screenshots
<img width="2400" height="1794" alt="01-page1"
src="https://github.com/user-attachments/assets/d4a7effd-d167-4dd6-92f4-6e9174818acd"
/>
<img width="2400" height="1794" alt="02-search-single"
src="https://github.com/user-attachments/assets/cd113ca9-ff87-431f-b2f6-7f7d36f2b32a"
/>
## What
Several project pages loaded **every** `RuntimeEnvironment` row for a
project, including the archived preview-branch environments that are
never shown in the UI. On a project with heavy preview-branch usage that
means thousands of rows per load, producing a large result set and a
rare multi-second tail on the environment lookup (~30s outlier observed
via Insights on `RuntimeEnvironment` projectId lookups, fingerprint
`f2b3ecab…`).
The tail is dominated by the size of the result being
parsed/transferred, not by the query plan (it already used
`RuntimeEnvironment_projectId_idx` with no over-read). So the fix is to
stop returning archived branch environments.
## Diagnosis correction
The ticket framed this as a "large `projectId IN` list" and suggested
bounding the IN list / cursor pagination. It's actually a Prisma
**nested relation load** on a *single-project* `project.findFirst`, so
the `IN (...)` holds one projectId and the trailing `OFFSET $1` is
Prisma's relation-subquery artifact. The 4,644 rows in the observed
execution were **one project with ~4,644 environments** (accumulated
archived branches), not many projects.
## Change
Filter the `environments` relation load to `archivedAt: null` (base envs
never archive, so only archived preview branches are excluded):
- `ProjectPresenter.server.ts`
-
`orgs.$organizationSlug.projects.$projectParam.{concurrency,apikeys,environment-variables,settings}.ts`
(best-env resolvers)
And remove an **unused** `environments` select from
`DeploymentListPresenter.server.ts` (it was selected but never read).
`loadProjectEnvironments` (replay route) already filters `archivedAt:
null` + env type; this change follows that existing precedent.
## Evidence (isolated stack, seeded one project with 2,000 archived
branch envs + 4 active)
`EXPLAIN (ANALYZE)` of the exact presenter sub-select:
| | rows returned | index |
|---|---|---|
| before (unfiltered) | **2004** | `RuntimeEnvironment_projectId_idx` |
| after (`archivedAt IS NULL`) | **4** (`Rows Removed by Filter: 2000`)
| same index, no plan change |
500x fewer rows to the client, which is what removes the parse-on-load
tail. No new index needed. `typecheck --filter webapp` clean. UI
verified: project layout, Deploys page, and the concurrency best-env
redirect all render with the 2,000 archived branches present in the DB
and zero console errors.
## Rollout / rollback
Straight deploy, no migration. Rollback is revert-only (read-path
filter, no data change). Old and in-flight rows read correctly under
both the old and new code.
## Limitation
A project with thousands of *active* branches would still load them all;
in practice active branches are few (branches are archived when their
work merges). Hard-bounding active branches would be a larger change and
is out of scope here.
## Summary
Opening the billing limits page while a spend limit was being enforced
could time out with no response for organizations with many preview
branches. That is exactly the moment the page matters: it is the only
self-serve way to raise or resolve the limit. The page now loads fast
regardless of how many environments the organization has.
## Root cause and fix
The loader's queued-run count ran one ClickHouse count per billable
environment, sequentially, with no timeout, and the environment list
included every archived preview branch ever created. Thousands of
environments times one round trip each held the response open past the
edge timeout.
The count is now a single org-level ClickHouse query filtered on
environment type, capped server-side with max_execution_time. If the
count fails, the loader falls back to 0 (the page hides the count label
at 0) instead of throwing, so the recovery panel stays reachable even
when the count errors. The billing-limit bulk-cancel path also stops
enumerating archived environments.
Restores the page-header docs buttons removed in #4529 / #4418, shown
only when the dashboard agent is unavailable (feature flag off, or pages
outside the environment layout). The buttons are restored verbatim at
their original spots — 22 sites across 21 files — wrapped in a small
`WhenAgentUnavailable` gate that reads the agent context (SSR-safe, no
hydration flicker).
Also: in the light theme, the query editor's Format/Clear/Copy toolbar
gets a translucent white background (`light:bg-white/80`) instead of
transparent, so it no longer blends into the code behind it.
<img width="1215" height="133" alt="Screenshot 2026-08-12 at 17 26 02"
src="https://github.com/user-attachments/assets/4bdba825-9cbd-4df4-b6ca-0ea6691a534b"
/>
<!-- ccr-slack-attribution -->
_Requested by **Eric Allam** · [Slack
thread](https://triggerdotdev.slack.com/archives/C0BEM9Z73TM/p1786528784863449)_
**Before:** you're on the API keys page in project X, you switch to
project Y in the sidebar, and you land on project Y's Tasks page. Same
for switching organization. Every switch threw away the page you were
looking at.
**After:** you land on project Y's API keys page. Switching organization
does the same thing, one project down. Pages that name a single thing —
a run, a batch, a queue, a schedule, a deploy, a session, an error group
— can't exist in another project, so those take you to the matching list
page instead (a run page takes you to Runs).
The environment is still chosen exactly as it is today: nothing tries to
guess it in the browser.
---
## Testing
- New `apps/webapp/app/utils/pageSwitching.test.ts` (35 tests). It reads
the compiled Remix route manifest, so the portable-page list can't
silently drift from the routes:
- every environment page that names no resource survives an environment
switch — the same pages the old slug swap kept
- the two branch lists are the only pages an environment switch keeps
and a project switch drops
- the pages gated per organization — Logs, Query and the queue metrics
dashboard — travel with an environment or project switch but not an
organization switch, and that list is derived from the route sources so
a new gated page cannot be missed
- every portable page points at a route that exists
- every one of the 19 environment routes that takes a resource id
truncates to a list page, with the id gone
- portable pages resolve to themselves, so switching twice lands in the
same place
- every rejection case: leading slash, `//`, absolute URL, `..`,
percent-encoded traversal, `javascript:`, unknown page — each falls back
to Tasks rather than being sanitised into something
- Manual: switch project and organization from API keys, project
settings, a run page, and a queue page.
- `pnpm run typecheck --filter webapp` passes.
- The rest of the webapp suite needs Docker for testcontainers, which
wasn't available here; all colocated pure unit tests under `app/utils/`
pass (15 files, 150 tests).
---
## Changelog
Switching project or organization in the sidebar keeps you on the same
page instead of sending you back to Tasks. Pages for a specific run,
deploy or other single item open the matching list instead.
---
## How
The switcher links already pointed at `/orgs/:org/projects/:project` and
`/orgs/:org`, whose `_index` loaders resolve the best environment (and,
for the organization, the best project) and redirect. So the page
travels as a search param on those links, and each loader appends it to
the path it already builds:
- `app/utils/pageSwitching.ts` — one pure module.
`environmentPortablePage(suffix)` and `projectPortablePage(suffix)` walk
up the suffix until they find an entry in an allowlist of portable
pages, and answer with the environment root if they find none. The
result is therefore always a literal from that closed set, which is what
makes it safe to concatenate into a redirect target; there is no regex
sanitising. The allowlist is built from the landing pages already listed
in `deeplinkPages.ts` plus the handful of nested pages that file doesn't
know about, so this isn't a new URL-shape table.
- `app/hooks/useEnvironmentSwitcher.ts` — `usePageSwitcher()` derives
the current page by slicing the environment layout route match's
pathname off the current pathname, so there's no route table on the
client either. The query string and hash are dropped on a project or
organization switch, since filters encode task slugs and ids scoped to
the project you're leaving.
- Both `_index` loaders re-validate the page through the same function
before using it.
Two things worth a look:
- **The environment switcher's truncation gap is fixed as a side
effect.** It had a hand-written switch covering `runs/:runParam`,
`deployments/:deploymentParam` and `schedules/:scheduleParam`; the other
16 id-bearing routes carried their id straight into the new environment
(e.g. `queues/:queueParam`, `batches/:batchParam`,
`errors/:fingerprint`, `sessions/:sessionParam`). All three switchers
now share one truncation, and the test asserts it covers every such
route in the manifest.
- **Portability turned out to be two properties, not one.** Preview
branches and dev branches render under any environment slug of their
project — both loaders pass a hardcoded environment type and the project
slug and never read `envParam` — so an environment switch keeps them,
exactly as swapping the slug did before. A project or organization
switch still falls back to Tasks, since the project you land in may have
no preview branches. A test locks the environment half: every id-free
page below an environment has to survive an environment switch.
---
## Screenshots
_n/a — no visual change; only where the switcher links point._
💯
---------
Co-authored-by: Claude <noreply@anthropic.com>
Plain sends `customer.externalId` as an explicit `null` rather than
omitting the key. The schema validated it with `z.string().optional()`,
which accepts `undefined` but rejects `null`, so every customer we don't
set an `externalId` for got a 400 instead of a card — while the rest
worked, which made it look intermittent.
`email`, `externalId` and `thread` are now `nullish`. One of
email/externalId is still required, and the route's existing email
fallback resolves these customers.
Three related fixes in the same path:
- The route returned `{ cards: [] }` when no user matched. Plain records
an integration error for any requested key it doesn't get back, so that
surfaced as a broken card rather than a hidden one. Every requested key
is now answered, with `components: null` where there's no data.
- The impersonation link is offered only when the customer matched on
`externalId` — a value we set ourselves. An email match is a weaker
claim, since the address on a Plain customer isn't verified and for
customers created outside our own writes it comes from whoever sent the
message. Email-matched customers get the account rows without a
one-click impersonation link.
- The not-found log recorded raw customer identifiers; it now keeps
presence flags only.
The schema and the response helper moved to
`app/utils/plainCustomerCards.ts` so they can be unit-tested without
pulling in the db and env modules.
## Testing
`app/utils/plainCustomerCards.test.ts` — 11 tests covering the null
shapes, the every-key-answered response, and the missing-vs-zero
distinction. Verified locally.
Split out of #4571, which bundled this with an unrelated impersonation
fix.
## Summary
The two personal-access-token lookups by `userId` (one also filtering
`revokedAt is null`, the other also filtering `name`) had no index on
`userId`, so each did a full sequential scan of the
`PersonalAccessToken` table to return a single row. `userId` is also an
unindexed foreign key.
## Fix
Add a single `@@index([userId])`. A user owns only a handful of PATs, so
once `userId` is indexed each lookup touches a few rows and the residual
`revokedAt` / `name` filter is trivial. Both query shapes lead with
`userId =`, so one index serves both and a composite would only add
write cost. The migration uses `CREATE INDEX CONCURRENTLY IF NOT
EXISTS`, which is online-safe under write load and reversible by
dropping the index.
Verified with a seeded local EXPLAIN: both queries go from a full
sequential scan to an index scan on the new index.
## What
`OrganizationsPresenter.#getOrganizations` selected a Prisma
`_count.members` relation on every org-list load (hit on nearly every
dashboard navigation). Prisma lowers that relation `_count` to a
whole-`OrgMember`-table `GROUP BY organizationId` aggregate joined onto
`Organization`. The computed `membersCount` field is read by **nothing**
in the webapp, so the entire aggregate scan is wasted work.
This removes the `_count` select and the `membersCount` field. The query
keeps only the indexed `EXISTS` membership filter and the org/project
selects.
## Why it's safe
- `membersCount` has zero consumers (whole-webapp grep finds the name
only at the point of assignment). It was added in #1796 (2023) and has
been unused since.
- The member count shown on the org settings/team page comes from a
separate presenter query, not this one. No user-visible change.
## Evidence (generated SQL, before/after, seeded isolated stack)
Before (with `_count.members`):
```sql
SELECT ..., COALESCE(aggr._aggr_count_members, 0)
FROM "Organization"
LEFT JOIN (SELECT "organizationId", COUNT(*) AS _aggr_count_members
FROM "OrgMember" GROUP BY "organizationId") aggr ON ...
WHERE EXISTS (... "userId" = $1 ...) AND "deletedAt" IS NULL
ORDER BY "createdAt" DESC
```
After:
```sql
SELECT id, slug, title, avatar, "featureFlags"
FROM "Organization"
WHERE EXISTS (... "userId" = $1 ...) AND "deletedAt" IS NULL
ORDER BY "createdAt" DESC
```
The whole-table `GROUP BY` aggregate is gone. The only remaining
`OrgMember` access is the `EXISTS` on the caller's own membership
(indexed by `userId`, a handful of rows). This is the single largest
read-amplification query on the control-plane database (~1.39B rows
read/day, ~719s DB CPU/day per Insights); removing it takes that portion
to zero.
Webapp typecheck passes.
## Rollout
Straight deploy, zero blast radius. Rollback is a plain revert, no data
migration.
refs TRI-13170
## What
The `billingLimit.reconcileTick` worker calls
`getOrgIdsWithBillingPauseSource()` on
`BILLING_LIMIT_RECONCILE_INTERVAL_MS` (~every 90s) to find which orgs
currently have billing-limit-paused environments. Two problems:
1. `RuntimeEnvironment.pauseSource` had no index, so `WHERE pauseSource
= 'BILLING_LIMIT'` was a **sequential scan of the whole table** on the
control-plane primary, every tick.
2. Prisma `distinct` dedups **after** fetching, so it read every paused
row (thousands) to produce a handful of distinct org ids.
This PR:
- Adds a **partial index** on `RuntimeEnvironment (pauseSource,
organizationId) WHERE pauseSource IS NOT NULL`. Nearly all rows have
`pauseSource = null`, so the index stays tiny. Second column lets the DB
satisfy the distinct-org lookup from the index. Defined in SQL (Prisma
can't express partial indexes), matching the existing partial-unique
indexes on this model.
- Switches the query from `findMany({ distinct })` to
`groupBy(["organizationId"])`, pushing DISTINCT into the DB so it
returns only the distinct orgs.
## Evidence
**Correctness** — colocated `postgresTest` (testcontainers, no mocks):
multiple `BILLING_LIMIT` envs in one org collapse to one org id,
`pauseSource = null` envs are excluded, each org id returned once. 5/5
tests in `billingLimitReconciliation.test.ts` pass.
**Plan change** — `EXPLAIN ANALYZE` on a synthetic table (200k rows,
5,250 `BILLING_LIMIT` across ~40 orgs, mirroring the test-side numbers
from the investigation):
| | Before (no index) | After (partial index) |
|---|---|---|
| Plan | Seq Scan (194,750 rows removed by filter) | Bitmap Index Scan
on partial index |
| Buffers | 1355 | 51 (index 6 + heap 45) |
| Exec time | 6.06 ms | 0.59 ms |
Index size 56 kB vs table 11 MB. The key win: cost now scales with the
paused-env count, not total table size, which matters most on prod where
the table is far larger.
## Rollout & rollback
- **Index**: `CREATE INDEX CONCURRENTLY IF NOT EXISTS`, in its own
migration file. Pre-apply the index manually on the control-plane
primary before deploying the migration (the migration is a no-op if the
index already exists).
- **Query change** is behavior-equivalent (same distinct org set), so no
flag needed.
- **Rollback**: revert the deploy and drop the index. No data migration
either direction.
## Notes / limitations
- The planner uses a Bitmap Heap Scan, so `organizationId` is still read
from the heap (45 blocks for the matched rows only, not the whole
table). A pure index-only scan isn't chosen for the bitmap path; the
second index column keeps that open for the index-scan path at
negligible cost.
refs TRI-13169
## What
Adds a composite index `@@index([environmentId, status, id])` to
`WorkerDeployment`.
The public deployments list (`GET /api/v1/deployments`) filters by
`status` and paginates by `id` descending. The existing indexes cover
`(environmentId, createdAt)` and the PK, but nothing covers `status`. So
for a status filter Postgres walks back through the environment's
deployments discarding non-matching statuses, reading roughly 350 rows
for every 1 returned (p99 ~1.1s on the busiest environments). The new
index makes the status filter index-satisfied and lets `id` serve both
the cursor range and the `ORDER BY id DESC`, bounding the read to a
single page.
Full composite (not partial) because callers filter by arbitrary status
values with no single dominant one.
## Query
```sql
SELECT ... FROM "WorkerDeployment"
WHERE "environmentId" = $1 AND "status" = $2 [AND "id" < $3]
ORDER BY "id" DESC LIMIT $4;
```
Source: `apps/webapp/app/routes/api.v1.deployments.ts`.
## Evidence
Reproduced on an isolated stack: one environment seeded with 7,000
deployments, the filtered status appearing 1 in 333 rows.
Before (no index):
```
Seq Scan on "WorkerDeployment" (rows=21)
Rows Removed by Filter: 6979
Buffers: shared hit=206
Execution Time: 2.9 ms (+ a sort for id desc)
```
After (with the index):
```
Index Scan Backward using "WorkerDeployment_environmentId_status_id_idx"
Index Cond: (environmentId = $1 AND status = $2)
Buffers: shared hit=23
Execution Time: 0.43 ms
```
Rows-removed-by-filter drops to 0; buffers 206 -> 23. The cursor
(mid-pagination) variant uses the same index with all three predicates
as the index condition. A dense/common status keeps the cheap PK
backward scan (already fine); the index targets exactly the rare-status
paths that were amplified.
End-to-end against the running webapp API: `?status=FAILED` returns the
correct newest-first page and paginates correctly across pages, and the
emitted SQL matches the query above.
## Rollout
- Index only, `CREATE INDEX CONCURRENTLY IF NOT EXISTS` in its own
migration file. Online-safe under write load.
- Pre-apply the index in production before the migration deploys, per
repo convention (the migration is then a no-op).
- Rollback: drop the index. No data migration.
refs TRI-13171
Plan enforcement for the dashboard agent — message quota and watch
limits — plus the component gallery, fixes and test hardening from the
same stack (#4548, #4549, #4550, #4552, #4556 merged here).
## Plan enforcement
([TRI-12863](https://linear.app/triggerdotdev/issue/TRI-12863))
**Agent message quota.** The Free-plan allowance becomes a real
server-side limit with a durable counter. New `agent_message_usage`
table keyed `(organization_id, period)` — deliberately not joined to
chats, so deleting a chat can't free quota within the period. Both send
paths count one user message (wakes never count) and refuse at the cap
with `403 message_quota_reached`, which the client renders as an upgrade
panel, never a silent drop. The refusal code is a single shared constant
on both sides.
**Watch limits.** A watch whose window exceeds the plan's
`agentWatchMaxHours`, or that would push the org past its
`agentWatchers` count, is refused with `watch_limit_reached` (409 on the
API, an upgrade hint on the card). Plan limits only tighten the existing
code ceilings (`min(plan, 24h)`, per-chat cap of 3 still applies). A
plan limit of zero means zero, not unlimited. Questions answerable
instantly are answered before any plan refusal — a one-shot consumes no
slot and never sees an upgrade nag.
**Fails open by design.** Cloud ships the actual per-plan numbers
separately (TRI-12863 P0). Until then absent limits resolve to the
unlimited sentinel and the upgrade UI is gated on billing presence —
self-hosted sees no cap, no upsell, with tests proving the fallback.
Both quotas are nudges, not security boundaries: a failing limit read
never blocks a send.
## Component gallery
An admin-only gallery of every agent card state: five
`storybook.agent-*` pages (chat UI, view blocks, report, investigation,
watch) with their shared shell and manifest, demo fixtures, two
demo-only cards, toast examples, and the screenshot script. No LLM and
no data — every state renders from fixtures under
`dashboard-agent/demo/`, never reachable from a production path.
Designers and reviewers can look at every state, including the report
states, without seeding anything.
## And fixes
**SDK: watch-mode chat subscriptions survive quiet windows** (TRI-13065,
TRI-13070) — watch mode keeps reconnecting across empty long-poll
windows and only stops on abort or a settled session; a passive
subscriber can no longer stop a turn it doesn't own (`stopOnAbort` is
explicit, default off). Review findings fixed alongside: a superseded
stream's async teardown no longer removes the live successor's abort
controller or multi-tab claim, and stopping a generation hands the chat
back to the user's other tabs.
**Query boundary pinned end-to-end**
([TRI-11165](https://linear.app/triggerdotdev/issue/TRI-11165)) — a
route-level test drives `api.v1.query` with a real signed environment
JWT (writes refused before ClickHouse, a read passes); `readonly=1` made
non-overridable; a per-turn cap stops the model burning a turn rewriting
a query it can't fix (deterministic SQL errors only — busy/transport
rejections don't count).
**chat.agent durability regression suite**
([TRI-11166](https://linear.app/triggerdotdev/issue/TRI-11166)) —
testcontainers-backed coverage of the two audit criticals (cross-tenant
isolation, no duplicate mid-stream turn, both control-broken) plus
crash-resume, cursor-based refresh, clean rollback of a mid-write turn
failure (torn by a real constraint violation), and OOM-restart replay.
**Investigation sweep backoff** — stale investigations get an attempt
counter and backoff so a poison row can't pin the sweep queue head
(migration `0005`: `sweep_attempts`, `last_sweep_attempt_at`).
## Screenshots
<img width="1440" height="791" alt="Screenshot 2026-08-06 at 00 36 19"
src="https://github.com/user-attachments/assets/6a68cd42-8580-469d-afe7-e28d1eef18e1"
/>
🤖 Generated with [Claude Code](https://claude.com/claude-code)
- New DB fields on Schedule and ScheduleInstance
- Use `queueTimestamp` for the "effectiveAt" delayed start time,
propagate it to Clickhouse TaskRun table
- Disable fastpath for delayed jobs
- Add schedule timing logic, API endpoints with windows, persistence
- Calculate phase for every schedule, only persist when window is
non-null
- Additional o11y for phased rollout
## Summary
Runs created for a Session were triggered without a realtime streams
version, so they fell through to the `realtimeStreamsVersion` column
default of `v1`. A Session's own `.in` / `.out` channels are always
`v2`, so any run-scoped `streams.append()` or `streams.pipe()` call made
inside a session run wrote to a different backend than the session it
belongs to, and stayed there for the life of the run.
The API trigger routes were never affected. They call
`determineRealtimeStreamsVersion` with the client's
`x-trigger-realtime-streams-version` header and always pass an explicit
value, so a current SDK asking for v2 gets it. Only the internal callers
that build trigger options by hand were leaning on the column default,
which no env var can influence because that path never calls the
resolver at all.
## The version resolver
Fixing the call site exposed a second problem in
`determineRealtimeStreamsVersion`. Its two paths disagreed: an explicit
`v2` was checked against the S2 configuration first, but when the caller
expressed no preference it returned `REALTIME_STREAMS_DEFAULT_VERSION`
verbatim with no check. A deployment that set the default to `v2`
without configuring S2 therefore stamped runs `v2`, nothing failed at
trigger time, and every later read or write against those runs' streams
threw `Realtime streams v2 is required for this run but S2 configuration
is missing` for the life of the run.
Both paths now resolve through one pure function that takes its
configuration rather than reading `env`:
```ts
const requested = streamVersion ?? config.defaultVersion;
if (requested !== "v2") return "v1";
const hasCredentials = Boolean(config.accessToken) || config.skipAccessTokens;
return hasCredentials && Boolean(config.basin) ? "v2" : "v1";
```
## The basin requirement
`resolveStreamBasin` resolves run, session and organization basins ahead
of the global setting, so a deployment that provisions a basin per
organization can serve v2 with no global basin at all. Gating purely on
the global setting would degrade every run there to `v1`.
`determineRealtimeStreamsVersion` therefore takes an optional
organization basin, and every caller that holds one passes it, including
the session path:
```ts
basin: organizationBasinName ?? env.REALTIME_STREAMS_S2_BASIN,
```
This is deliberately the resolved basin and not the
`REALTIME_STREAMS_PER_ORG_BASINS_ENABLED` flag. The flag says the
feature is on, not that a given organization has been provisioned, and
provisioning happens out of band. Keying off the flag would stamp `v2`
on runs for unprovisioned organizations, recreating the failure this
removes.
**This widens behaviour for explicit `v2` requests**, which previously
required the global basin: a provisioned organization on a per-org
deployment now resolves `v2` where it used to get `v1`. That is
intentional, and it makes every path agree.
## Scope
Only newly created runs change. A run already stamped `v1` keeps that
version for its lifetime by design, since readers resolve the backend
from the same column and its existing streams have to stay readable.
Scheduled runs reach the same column default through
`scheduleEngine.server.ts` and are deliberately left alone: that one is
a policy question about `REALTIME_STREAMS_DEFAULT_VERSION` rather than
an inconsistency inside a single feature.
## Verification
A full-stack e2e boots the real webapp plus Postgres, Redis and s2-lite,
creates a Session through the public API so the run comes from the real
trigger path, appends records the way `streams.append()` does, and
asserts three things at once: the version stamped on the run, that the
payload is readable from S2, and that no key exists in Redis. It appends
at a realistic record size so the route's body cap and S2's per-record
cap are both exercised. Reverting the session-path change flips all
three observations, so it fails against the old behaviour rather than
passing vacuously.
Unit tests cover the resolver matrix, including organization-basin-only
and credential-only configurations; two of them fail against the
previous resolver.
Also verified by hand against a local stack: a real `chat.agent` session
run writing 8 records of 250KB through `streams.append()` put 2,049,072
bytes into S2 with no Redis key, while the same agent with the
session-path change removed put 2,102,360 bytes into Redis and nothing
into S2.
fix(webapp): include Tailwind in production image
## Summary
Include `tailwindcss` in the webapp production dependencies so
self-hosted Docker images can render emails that use React Email's
Tailwind component.
Watch is the agent noticing something later: you ask it to tell you when
a condition holds, and it answers when it does — or when it can't any
more.
A watch is a **durable one-shot promise**. The condition is checked on a
schedule by deterministic code (no LLM in the checks), the answer lands
in the chat once, and then the watch is over. Ten kinds: three on a run,
five on a queue, error recurrence, health recovery.
## Stack
Stacked on **#4529** (UI), which is stacked on **#4418** (chat, reports,
investigate). Merge those first. **#4516** (storybook gallery) sits on
top of this branch.
## How to review
[**GUIDEBOOK.md**](https://github.com/triggerdotdev/trigger.dev/blob/feat/dashboard-agent-flows-watch/internal-packages/dashboard-agent/GUIDEBOOK.md)
on this branch is the behaviour reference — it states the conditions
rather than the code, so you can predict what happens without running
anything. "The ten watch kinds, and what makes each fire" and "Creating
a watch" describe exactly this PR, and the tables there are the spec the
code is written against.
## What's inside
- **Ten watch kinds**, one deterministic check each
(`dashboardAgentWatch*Checks.ts`), with the spec union in
`dashboard-agent-contracts/src/watch.ts`.
- **Scheduling** — each watch schedules its own next check; due watches
of one `(environment, cadence)` group can be checked together in one
batch pass, with a sweep as the backstop for expiry, redelivery and
retention.
- **Delivery** — the in-chat wake and card, an optional email alert (new
`DASHBOARD_AGENT_WATCH` alert channel, so it shows on the project's
Alerts page with one-click unsubscribe), and an optional investigation
when the outcome needs attention.
- **Submission ledger** — `watch_submissions`, keyed `(chat_id,
client_request_id)`, so a retried card submission replays the recorded
outcome instead of creating a second watch.
- **Watch token** — a delayed-execution credential accepted only by the
watch endpoints, re-checked against the user's live access on every
tick.
- **Unread work** — the panel polls for wakes that landed while it was
closed, so a chat can go unread and light the launcher dot.
## Key decisions
**A check result is a 4-way, and only two of them are verdicts.**
`satisfied` / `terminal_unsatisfied` are answers; `pending` and
`unavailable` are not. Any exception inside any check is caught in one
place and becomes `unavailable` with an unverified observation — a check
that failed is never evidence.
**A completed window is an answer, and whether it is good or bad news is
declared per kind, never inferred.** There is a table for that in the
guidebook: `run_failed` completing its window is *good* news ("hasn't
failed"), `backlog_drain` completing it is not. One rule overrides the
table: a window that completed on an unverified observation is neutral
and says only that the watch ended without a confirmed answer. **An
unreadable source is never a negative answer** — and, because
investigations only open on `attention`, it never starts one either.
**Identity is `(chat, project, environment)` plus the condition,**
enforced by a partial unique index over active rows
(`watches_chat_active_identity_key`), not by the read-then-insert check.
Cadence, window, note and `ticks` are deliberately not part of it. Two
different chats may watch the same thing — a watch is a promise to a
chat.
**The server resolves the target's name, whatever the model calls it.**
The model can't tell a task queue (`task/<id>`) from a custom queue, so
both spellings are tried and the stored one wins — and the rewrite
happens **before** identity and before the row is written, so the
identity, the checks, the link and the wording all see one spelling.
**Freshness fences.** Depth falls back from the live counter to the
newest 60 s ClickHouse bucket, which only counts as current within 60 s
of now. A non-current reading at or below the *quiet line* is refused as
`unavailable` rather than believed, so a stale empty bucket is never
read as "drained". The stall streak is the one piece of carried state:
it lives in the previous check's facts and *freezes* on an unreadable
reading rather than breaking.
**Chain reliability.** There is no shared cron — each watch (or batch
group) schedules its own next tick, so the failure mode to review is the
chain dying. A failed batch check is caught, the next tick is scheduled
anyway and the run resolves rather than failing, so the chain survives a
check that couldn't run; the sweep re-arms groups and finalizes anything
still active past its deadline, even when delivery isn't configured.
Wake redelivery is id-deduped rather than conditional, because the sweep
can't know whether the user was already told. Access is re-authorized on
**every** check against the primary — replica lag would extend access
the user has already lost.
**Wording lives in one place.** `watch-wording.ts` is read by the card,
banner, toast, email and the agent's own narration, and the numbers come
from the frozen observation rather than a fresh read, so a retry
produces the same sentence. Replay reproduces the **recorded** decision
instead of deciding again — the transcript is append-once, so a second
decision would contradict it forever.
**Cancellation is the ending without an answer** — no resolution, no
wake. One exception, decided during testing: a watch the *user*
cancelled leaves a single neutral transcript line ("Stopped watching
…"), keyed off the watch id so a retry can't repeat it. The other four
reasons stay silent.
**Email is opt-in and only a fired watch emails.** An expiry is narrated
in the chat and nowhere else. Both gates (agent access, a configured
email transport) are checked at subscribe time *and* again at delivery,
and the subscription outcome is frozen on the ledger row so a retry
replays it. Neither gate is a plan check.
**One watch offer per turn.** The prompt and the renderer guard this
independently — if the turn already proposed a watch card, the action
button is dropped, because the card is the better affordance. Two eval
cases pin the prompt side: exactly one offer with the line last and the
button after it, and zero offers when the rendered card already carries
one — deterministic assertions, over a real-model run.
## Testing
Unit tests (vitest, testcontainers, no mocks) under
`apps/webapp/test/dashboardAgentWatch*.test.ts` and
`internal-packages/dashboard-agent/src/watch-*.test.ts` cover the
invariants above: the 4-way check results and the freshness fences,
identity/dedup and the submission ledger, queue-name resolution, the
batch chain surviving a failed check, sweep boundaries and alert-once,
tenancy and the watch token's scope, and the wording snapshot. The
load-bearing ones were verified by control-breaking the guard first and
checking the test goes red.
Live-tested end to end against a local stack, following the guidebook:
all ten watch kinds firing and expiring, cancellation, the email pair (a
fired watch mails, an expired one does not), and watch recovery from a
health report.
## Summary
Background worker registration runs on every deploy and every `trigger
dev` file save. Its declarative-schedule reconcile loaded every
declarative schedule for the whole project across all environments, then
re-fetched the deletion candidates it already had in memory. For
projects with many scheduled tasks or many environments, that meant
reading tens of thousands of rows on each registration. This scopes the
load to the environment being registered, drops the redundant re-fetch,
and selects only the columns the reconcile needs.
It also fixes the schedule-limit count (`getUsedSchedulesCount`), which
joined `TaskSchedule` and `RuntimeEnvironment` without a project
constraint and could scan those tables in full. Pushing `projectId` onto
both joins gives it a project-scoped index path with the same result.
Follow-up to
[#4522](https://github.com/triggerdotdev/trigger.dev/pull/4522), which
batched the delete side of the same reconcile.
## Summary
Setting or importing environment variables ran a conflict pre-check that
loaded every variable in the project and every value across all of its
environments, only to decide whether the submitted keys already had a
value in the target environments. On projects with many variables and
environments that meant reading tens of thousands of rows on each
create/import call.
This scopes the pre-check to the submitted keys and target environments,
so it reads only the rows it actually inspects (submitted keys × target
envs), wrapped in `boundedIn` to keep the prepared-statement cache
stable. Same conflict detection, a handful of rows instead of the whole
project's env-var values.
Stacked on #4418. Merge that first.
The UI slice of the dashboard agent: the side panel, the chat transport
wiring, message and card rendering, suggested prompts, and chat history.
#4418 works without this — the system is simply invisible. The diff is
mostly components, so the notes below cover only the three decisions you
can't read off the markup. Behavior and a hands-on walkthrough live in
GUIDEBOOK.md, which lands with #4525.
## Decisions worth knowing
- **Action rows always render at the end of a turn.** The model's
emission order isn't trusted for layout, so action blocks are split out
of the stream and appended last. Display only — `answered` stays keyed
on the emission index.
- **The last-chat memory is org-true.** It's keyed by the chat's own
organization, and a foreign or deleted chat comes back as a 404 the
client treats as gone, rather than an empty chat it keeps around.
- **A dead stream self-heals from the settled transcript.** Terminal
records are written to the chat row after the client's stream closes, so
the panel re-reads it. The poll gate is any unfinished turn — a dangling
tool part, not just an open investigation.
## Notes
- Gated by `canAccessDashboardAgent`; no behavior change with the flag
off.
- Page marks: `handle.agentPageContext` on 47 routes, ~20 lines each.
- Entry points: Ask Trigger button, ⌘J, Help & Feedback. The old ⌘I and
`?aiHelp=` links keep working.
## Screenshots
<img width="1440" height="788" alt="Screenshot 2026-08-07 at 15 14 29"
src="https://github.com/user-attachments/assets/f4e89e8d-13ed-4be3-a88d-d5cca3ece0fa"
/>
## What & why
This is the system behind the Dashboard Agent — an assistant that
answers questions about a project's runs, errors, queues, deploys and
health, and can investigate failures end to end.
The agent runs as a chat.agent task in its own Trigger project. It has
no access to the main database or ClickHouse; all platform data is read
through the public API using a delegated, read-only user token.
Everything here is behind `canAccessDashboardAgent` and inert with the
flag off. The UI that mounts the panel lands in #4529.
## Stack
`#4418` (this, base) ← `#4529` UI ← `#4525` Watch ← `#4516` storybook
gallery. The scenario/contract reference for the whole stack is
`internal-packages/dashboard-agent/GUIDEBOOK.md` (it lands on the Watch
branch): it states, per feature, what makes each thing happen and where
that is decided.
## What's inside
**Agent runtime and tools** — `internal-packages/dashboard-agent`:
prompt, tool set (API reads, TRQL query, docs, navigation,
evidence/investigations, repo source), conversation compaction, a
prompt-prefix token budget pinned by snapshot test, and sampled
LLM-judged turn evals. The package cannot import webapp server code,
which is what makes the "no DB access" claim structural rather than a
convention.
**Contracts** — `internal-packages/dashboard-agent-contracts`:
`trigger://` URIs, intents, and the block envelope every rendered card
travels in.
**Conversation store** — `internal-packages/dashboard-agent-db`: drizzle
over postgres-js in its own `trigger_dashboard_agent` Postgres schema,
plus one additive migration.
**Auth boundary** — the user-actor token gains an optional environment
claim; one guard (`userActorEnvironment.server.ts`) enforces it so
routes don't each re-derive the rule. Token minting, cap ceiling, and
the RBAC fallback path for self-hosted.
**Transport** — webapp resource routes that mint the token and proxy
each turn, and SDK-side mid-turn reconnect.
**Public API the agent reads through** — orgs, projects, environments,
runs, queue metrics, workers, a run's commit metadata, repo snapshot,
reports, and `POST /api/v1/query`.
**Reports** — the health report's layout is declared once and shared by
the card, the markdown surface and the JSON/MCP surface, so the same
report reads the same in the dashboard, the terminal and an editor.
**Block renderers** — the report and investigation cards the flows above
already emit (`app/components/dashboard-agent/`). The panel that hosts
them, and the rest of the chat UI, is #4529.
**Query safety and CSP** — see below.
## Key decisions
- **The agent is a separate Trigger project, not webapp code.** It reads
platform data over the public API with a delegated user-actor token
whose `cap` ceilings it to read scopes. No Prisma, no ClickHouse, no
webapp imports.
- **The PAT-only auth helper now refuses user-actor tokens.** This is an
intentional behavioral change: its callers consume only a bare userId
and do not enforce delegated-token capabilities. Actor-aware routes
continue through the scoped route builders instead.
- **RBAC fallback builds a delegated token's ability from its own cap**,
never the blanket ability a PAT gets (read-only when the token declares
none). Without this, the agent's read-only cap would buy a write JWT on
self-hosted.
- **Org creation checks RBAC only for user-actor tokens, and only after
the env gate**, so an install with `ORG_CREATION_API_ENABLED` off
returns 404 rather than 403, and an ordinary PAT never consults an
ability the route has no org to scope. Both orderings are pinned by
test.
- **The query path is read-only in depth.** TRQL rejects write
statements at the grammar level (they don't parse, rather than being
filtered), ClickHouse runs with `readonly=1`, and the org/project/env
filters are injected server-side from the credential — the request body
cannot widen scope. An unparseable query denies instead of falling
through to the permissive resource.
- **Document-wide img-src CSP.** Remote images are an
outbound-request/exfiltration surface, so the policy permits only
own-origin/data/blob, the required SSO avatar hosts, and the favicon
endpoint. Operators can add exact origins through CSP_IMG_SRC_ALLOWLIST;
wildcard hosts and bare schemes are intentionally not allowed.
- **The chat transport reconnects on a mid-turn EOF**
(`@trigger.dev/sdk`). A body that ends without a turn-complete is
terminal only when the server says `X-Session-Settled: true`; otherwise
the transport resubscribes from `lastEventId` with bounded backoff, and
any record re-earns the budget. Previously a closed long-poll window or
a proxy restart left the reply stuck as if still generating.
- **Conversations live in their own datastore**, schema-scoped and
foreign-key-free (it references `organizationId`/`userId` by id, because
in cloud it is a different database). It is a display read-model for the
History tab and transport resume; `chat.agent`'s object-store snapshot
remains the model's source of truth.
- **Deterministic first.** Reports and health checks contain no LLM —
they are computed from the same data the dashboard shows, and the model
only narrates and links them. That is what makes a number in an answer
auditable.
## Testing
- 63 new test files, run with `pnpm run test --filter webapp` and
per-package vitest. Heaviest coverage on the auth boundary
(`userActorPatOnlyBoundary`, `userActorTokenClaimsAndScopes`,
`contextlessPatRoutes`, `rbacFallbackBranch`), TRQL read-only, the
report layout, and the SDK reconnect.
- The agent package has a separate eval lane (`pnpm run test:evals`,
`vitest.eval.config.ts`) that hits the real model, so it never runs in
`pnpm test`.
- Live-tested against a local stack scenario by scenario; the GUIDEBOOK
lists the condition each behaviour is expected under, which is what
those runs were checked against.
## Changelog
`.server-changes/dashboard-agent.md`, plus changesets for
`@trigger.dev/core` (report schemas), `@trigger.dev/sdk` (chat
reconnect) and the CLI's `mint-token` help text.
Most deploy-flow API calls shared the general per-environment rate limit
bucket with all of that environment's runtime traffic, so an org with
heavy API usage could intermittently 429 its own deploys; the
`/api/v*/deployments` endpoints themselves were fully exempt from rate
limits as a stopgap
([#2774](https://github.com/triggerdotdev/trigger.dev/pull/2774)), which
promised a dedicated limiter as the follow-up. This is that follow-up:
the whole deploy-flow group now runs on its own budget, separate from
runtime API limits.
### Design
A new `deploymentRateLimiter` covers every endpoint the deploy flow
depends on: the `/api/v*/deployments` group, the env API key exchange
(`/api/v1/projects/:ref/:env`), build-time env var resolution and sync
(`/envvars`, `/envvars/:slug/import`), preview branches,
`/api/v1/remote-build-provider-status` and `/api/v1/artifacts`. The
general API limiter whitelists the same shared path list, so exactly one
limiter applies to each path and the two can't drift apart.
Buckets are keyed per environment for environment API keys and per token
for the PAT-authenticated phase of a CLI deploy (whoami, key exchange,
branches). The deploy budget is controlled via the
`DEPLOYMENT_RATE_LIMIT_*` env vars.
## Summary
Adds a docs page for LLM observability: every opted-in Vercel AI SDK
call inside a task becomes its own span in the run trace, carrying the
model, provider, token counts, cost, and latency. The page covers
turning it on per call with `experimental_telemetry: { isEnabled: true
}`, what each span inspector tab shows (Overview, Messages, Tools, and a
Prompt tab when linked), linking a call to its prompt version with
`toAISDKTelemetry()`, and querying usage across runs with TRQL against
the `llm_metrics` table.
It sits in the AI dropdown under Features, next to
[Prompts](https://trigger.dev/docs/ai/prompts), and cross-links the
[Query](https://trigger.dev/docs/observability/query) page.
It is explicit that capture is opt-in per call (not automatic) and only
covers Vercel AI SDK calls, and notes the `@ai-sdk/otel` requirement on
AI SDK 7. Every API name, span tab, and TRQL column was checked against
the SDK and the live query schema.
## Also in this PR
Corrects one bullet in the [AI Agents
overview](https://trigger.dev/docs/ai-chat/overview): it claimed an
in-progress chat resumes on the new version after a redeploy, which
contradicts the version-upgrades and backend pages. Chat agent runs are
pinned to the version they started on; moving onto new code is an
explicit version upgrade.
## Summary
Adds a "Build a chat agent" guide to the AI agents section, surfaces the
ClickHouse chat agent example in the guides index and the AI agents
overview,
and refreshes the five existing workflow guides so their code is
current.
## Details
The pattern guides (prompt chaining, routing, parallelization,
orchestrator,
evaluator-optimizer) still used retired models and dated APIs. Updated
them to
current Anthropic Claude models (claude-haiku-4-5 for lightweight
classifier
roles, claude-sonnet-4-5 for the main work) and modernized the code:
- route-question uses generateObject for the routing decision instead of
generateText plus manual JSON parsing.
- verify-news-article uses ModelMessage in place of the renamed
CoreMessage.
- Fixed translate-and-refine discarding its recursive refinement result,
so
refined translations never returned to the caller.
- Fixed an invalid JSON test payload in generate-translate-copy.
The pattern concepts are unchanged; only the example code was stale.
## Summary
The dev environment "Get set up" panel used to be a static list of CLI
commands that only disappeared once your tasks registered, so nothing
ever changed after you ran `init` and people assumed it was stuck. It
now tracks real progress: `trigger init` records the project as
initialized, so step 1 checks off, and the panel updates live as the dev
server connects and your tasks register.
It also adds a prominent "Copy AI agent prompt" button, presented as a
clear alternative ("or") to the manual CLI steps, that copies a
ready-to-paste setup prompt pre-filled with your project reference for
Claude Code, Cursor, or any coding agent.
## Notes
- Adds a `Project.initializedAt` column (migration
`20260811065646_add_project_initialized_at`); the CLI `init` command
calls a new project-scoped `POST /api/v1/projects/:ref/init` best-effort
at the end of setup.
- The `init` scaffold now imports from `@trigger.dev/sdk` instead of the
deprecated `/v3` subpath.
## Screenshots
<img width="2400" height="1794" alt="v7-redesigned-card"
src="https://github.com/user-attachments/assets/c2fb4fa1-9484-4700-8bd3-110d66f5a44e"
/>
🚀 Publish Trigger.dev Docker / typecheck (push) Failing after 0s
🚀 Publish Trigger.dev Docker / units (push) Failing after 0s
🚀 Publish Trigger.dev Docker / publish-webapp (push) Has been skipped
🚀 Publish Trigger.dev Docker / publish-worker-v4 (push) Has been skipped
🚀 Publish Trigger.dev Docker / scan-webapp (push) Has been skipped
🚀 Publish Trigger.dev Docker / scan-supervisor (push) Has been skipped
🦋 Changesets PR / Create Release PR (push) Has been cancelled
🚀 Publish Trigger.dev Docker / 📣 Dispatch main image (push) Has been cancelled
## Summary
Adds an opt-in path to serve a run's per-run configuration reads from
the control-plane read replica instead of the primary, reducing primary
database load during task execution. The managed-worker dequeue resolves
each run's environment, organization, and environment variables before
starting the run; those rows are stable for the life of a run, so they
can safely come from the replica.
Gated by `CONTROL_PLANE_DEQUEUE_READS_FROM_REPLICA`, defaulting to `"0"`
(reads from the primary, unchanged from today). Set it to `"1"` to route
the reads to the replica. The env-var read is scoped to the
dequeue/resolution path (`resolveVariablesForEnvironment`); dashboard
env-var reads and writes always stay on the primary. When no read
replica is configured, `$replica` transparently falls back to the
writer, so single-database self-host is unchanged either way.
Verified end-to-end against a real primary/replica split, in both
`trigger dev` and deployed (managed-worker) runs: with the flag on, env
vars inject correctly and a value set immediately before triggering a
deployed run is present on the run.
## Why this change
`EnvironmentVariableValue.valueReference` is an `onDelete: SetNull`
foreign key. Deleting a `SecretReference` (the env var edit/delete path
for secret values) fires the cascade `UPDATE ONLY
"EnvironmentVariableValue" SET "valueReferenceId" = NULL WHERE $1 =
"valueReferenceId"`. That cascade is scan-shaped: with no index on
`valueReferenceId`, it reads the entire table to find the rows
referencing the deleted secret. The parent `SecretReference` delete does
almost no work itself; its latency is dominated by this cascade.
## Diagnosis
`EnvironmentVariableValue` was indexed on `environmentId` and
`(variableId, environmentId)`, but not on `valueReferenceId`. The SET
NULL cascade therefore did a full sequential scan of the whole table.
Two sibling SET NULL cascades on the same delete
(`OrganizationIntegration.tokenReferenceId`,
`User.mfaSecretReferenceId`) are index-backed and stay fast, which
isolates the missing index as the cause.
## Change
Add `@@index([valueReferenceId])` on `EnvironmentVariableValue`, created
with `CREATE INDEX CONCURRENTLY IF NOT EXISTS` so `prisma migrate
deploy` stays safe on a live table.
## Benchmark (local, seeded)
Local Postgres seeded with 1,000,000 `EnvironmentVariableValue` rows,
`EXPLAIN (ANALYZE, BUFFERS)` on the SET NULL cascade with zero matching
rows (the worst case: reads the whole table, affects nothing):
| | before | after |
|---|---|---|
| plan | Seq Scan (1M rows) | Bitmap Index Scan |
| execution | 183 ms | 2.8 ms |
In a variant where the secret matched several thousand rows, the parent
`SecretReference` delete's
`EnvironmentVariableValue_valueReferenceId_fkey` trigger dropped from
216 ms to 88 ms (the residual is the heap work of nulling those rows).
## Expected impact
The cascade drops from a full-table sequential scan to a targeted index
lookup. The win grows with the table, so the benefit is larger than the
seeded numbers above.
## Risks
- One extra btree to maintain on `EnvironmentVariableValue` writes;
small, single-column, and it should be pre-created before the migration
deploys (per the repo index rules).
- No behavior change: same rows nulled, no ordering or result-set
change, read paths untouched.
Companion to the same fix on `ProjectAlert.channelId`.
## Why this change
Deleting a `ProjectAlertChannel` fires the FK cascade `DELETE FROM ONLY
"ProjectAlert" WHERE $1 = "channelId"`. That cascade is scan-shaped:
with no index on `channelId`, it reads the entire `ProjectAlert` table
to find the few child rows belonging to the deleted channel. The parent
`DELETE ProjectAlertChannel` does almost no work itself; its latency is
dominated by this cascade. `ProjectAlert` is append-heavy and grows over
time, so the scan cost only increases.
## Diagnosis
`ProjectAlert` had no index on `channelId` (only `pkey` + a `friendlyId`
unique). The cascade therefore did a full sequential scan of the whole
table. The sibling `ProjectAlertStorage` cascade on the same delete is
index-backed and stays fast, which isolates the missing index as the
cause.
## Change
Add `@@index([channelId])` on `ProjectAlert`, created with `CREATE INDEX
CONCURRENTLY IF NOT EXISTS` so `prisma migrate deploy` stays safe on a
live table.
## Benchmark (local, seeded)
Local Postgres seeded with 1,000,000 `ProjectAlert` rows across 50
channels (~20k rows per channel), `EXPLAIN (ANALYZE, BUFFERS)` on the
cascade delete:
| | before | after |
|---|---|---|
| plan | Seq Scan (1M rows) | Bitmap Index Scan |
| direct child delete | 740 ms | 22 ms |
| parent delete `ProjectAlert_channelId_fkey` trigger | 77.7 ms | 23.8
ms |
## Expected impact
The cascade drops from a full-table sequential scan to a targeted index
lookup. The win grows with the table: the more rows in `ProjectAlert`,
the more a scan costs and the more the index saves, so the benefit is
larger than the seeded numbers above.
## Risks
- One extra btree to maintain on every `ProjectAlert` insert; acceptable
for a single-column index on a high-insert table, and it should be
pre-created before the migration deploys (per the repo index rules).
- No behavior change: no rows orphaned, no ordering or result-set
change, read paths untouched.
## Follow-up
`ProjectAlert`'s other cascade FK columns (`projectId`, `environmentId`,
`workerDeploymentId`) are also unindexed, but their parents are
soft-deleted rather than physically removed, so those cascades do not
currently fire. Lower priority unless a hard-delete path is introduced.
## What
Follow-up to #4539. The driver-adapter work is inert until a client
flips to the pg driver adapter, but the moment one does, our database
observability degrades: the OTel metrics pipeline reads pool stats from
Prisma's `$metrics`, which is owned by the Rust engine's `quaint` pool.
Under the adapter, `pg.Pool` owns the pool, so those gauges read zero.
The pipeline also only ever scraped a single client (the control-plane
writer singleton).
This PR makes database metrics driver-agnostic and per-client:
- Every configured client registers a metrics source: control-plane
writer/replica, run-ops writer/replica, legacy writer/replica.
Previously only the control-plane writer singleton was scraped.
- Each OTel instrument is observed per client with `db_client` and
`db_driver` (`quaint` | `pg-adapter`) attributes. `db_client` uses our
canonical datasource-role labels (`control-plane-writer`,
`control-plane-replica`, `run-ops-writer`, `run-ops-replica`,
`legacy-run-ops-writer`, `legacy-run-ops-replica`) — the same strings
used for the `db.datasource` span attribute, so a metric and a trace
point at the same pool.
- Pool figures come from the authoritative source per driver:
- **pg-adapter**: `pg.Pool` (`totalCount`/`idleCount`/`waitingCount`,
plus cumulative opened/closed from `connect`/`remove` events).
- **quaint**: the Rust engine's `$metrics` pool gauges/counters, exactly
as before.
- Query counters and duration histograms still come from `$metrics` for
both drivers (the Rust engine executes queries in both cases).
- New `db.pool.connections.waiting` gauge (pg.Pool exposes this; quaint
reports 0).
- Stops exporting Prisma metrics from the Prometheus `/metrics` route.
Pool observability now lives entirely in the OTel pipeline, per driver,
per client.
## Why
So we can flip any client (including the control-plane writer, the
primary desync-fix target) to the driver adapter without losing pool
visibility. Existing dashboards keyed on the same metric names keep
working; they gain a per-client dimension.
## Testing
Unit (`apps/webapp/app/utils/databaseMetrics.server.test.ts`): the pure
normalizer — quaint reads pool from `$metrics`; adapter reads pool from
`pg.Pool` and keeps engine query metrics; `busy` never goes negative;
graceful zeroing when `$metrics` is unavailable (adapter still reports
live pool figures).
Live smoke test against a prod-shaped local stack: three
physically-distinct Postgres DBs (control-plane, run-ops, legacy) behind
dual PgBouncers, split mode on, with a mix of adapter and quaint
clients. Reading the actual emitted OTel metrics, every pool shows up as
its own series:
```
db.pool.connections.total{db_client="control-plane-writer", db_driver="pg-adapter"} = 1
db.pool.connections.total{db_client="control-plane-replica", db_driver="quaint"} = 1
db.pool.connections.total{db_client="run-ops-writer", db_driver="pg-adapter"} = 1
db.pool.connections.total{db_client="run-ops-replica", db_driver="quaint"} = 1
db.pool.connections.total{db_client="legacy-run-ops-writer", db_driver="quaint"} = 1
db.pool.connections.total{db_client="legacy-run-ops-replica",db_driver="quaint"} = 1
db.client.queries.total{db_client="control-plane-writer",db_driver="pg-adapter"} = incrementing
db.client.queries.duration.count{db_client="control-plane-writer",db_driver="pg-adapter"} = incrementing
```
Confirms: metrics are attributed per pool with the correct driver;
adapter pools' figures come from `pg.Pool`; and query counters/duration
histograms keep incrementing under the pg adapter. Also verified
`/metrics` (Prometheus) now returns zero `prisma_*` series while still
serving the app's own metrics.
`pnpm run typecheck --filter webapp` passes.
## Notes
- `/metrics` (Prometheus) no longer includes `prisma_*` series. Anything
scraping that endpoint for Prisma metrics should read the equivalent
`db.*` metrics from the OTel exporter instead.
- **PgBouncer + `?schema=` gotcha (separate from this PR, worth flagging
for rollout):** since #4539 parses `?schema=` from the DSN and passes `{
schema }` to the adapter, node-postgres sends `search_path` as a startup
parameter. A transaction-mode PgBouncer rejects that with `FATAL:
unsupported startup parameter: search_path`. Our prod control-plane DSNs
use the default `public` schema with no `?schema=` param, so this is
latent, but any client we flip to the adapter must not carry `?schema=`
in its DSN (or the pooler needs `ignore_startup_parameters =
search_path`).
---------
Co-authored-by: Claude Opus 4.8 (1M context) <noreply@anthropic.com>
Deploy images previously shipped node_modules and the bundled task code
in a single layer, so every deploy re-pushed and re-pulled the full
dependency tree even when nothing in it changed. The generated
Containerfile now copies `/app/node_modules` as its own layer and the
app files separately. With unchanged dependencies the dependency layer
is identical across deploys, so registries and workers already have it
and only the code layer moves.
When the health report had no start-latency measurement for the window,
it printed a confident "p95 0ms" and graded it healthy. It now shows
"unknown" for that metric and skips grading it, so an absent measurement
can't read as a green signal.
A genuinely measured 0ms is still shown as 0ms: the loader keeps "no
measurement" distinct from a measured zero instead of coercing both to
0.
## Summary
Bumps the transitive `mermaid` in the lockfile from `11.14.0` to
`11.16.1`.
`mermaid` has no direct dependents here. It arrives through
`streamdown`,
which declares it as a hard dependency even though diagram rendering is
gated
behind the optional `@streamdown/mermaid` plugin, which we don't
install.
`streamdown@2.5.0` is its latest release, and its declared range
(`^11.12.2`)
already permits `11.16.1`, so this was a stale lockfile pin rather than
a
range conflict.
Done as a scoped override rather than a bare lockfile refresh, so the
floor
survives a lockfile regenerated from an older base:
```json
"mermaid@>=11 <11.16.1": "^11.16.1"
```
Net effect is 96 fewer lockfile lines, contained to mermaid's own
subtree.
`11.16.1` swapped out its parser, so the `langium` / `chevrotain@12` /
`vscode-languageserver-*` chain drops in favour of a single
`@chevrotain/types`, and `lodash-es` and `uuid@11` are no longer pulled
at
all.
The override goes away once `streamdown` makes `mermaid` an optional
peer of
its diagram plugin instead of a hard dependency.
🚀 Publish Trigger.dev Docker / typecheck (push) Failing after 0s
🚀 Publish Trigger.dev Docker / units (push) Failing after 0s
🚀 Publish Trigger.dev Docker / publish-webapp (push) Has been skipped
🚀 Publish Trigger.dev Docker / publish-worker-v4 (push) Has been skipped
🚀 Publish Trigger.dev Docker / scan-webapp (push) Has been skipped
🚀 Publish Trigger.dev Docker / scan-supervisor (push) Has been skipped
🦋 Changesets PR / Create Release PR (push) Has been cancelled
🚀 Publish Trigger.dev Docker / 📣 Dispatch main image (push) Has been cancelled
📚 Docs Checks / check-broken-links (push) Has been cancelled
🧭 Helm Chart Prerelease / lint-and-test (push) Has been cancelled
Workflow Checks / Actionlint (push) Has been cancelled
Workflow Checks / Zizmor (push) Has been cancelled
🧭 Helm Chart Prerelease / prerelease (push) Has been cancelled
## What
Adds an opt-in path to run each Prisma client through
**`@prisma/adapter-pg`** (the node-postgres driver) instead of the
built-in engine driver, controlled by a **per-client env var, all off by
default**:
| env var | client |
|---|---|
| `CONTROL_PLANE_DATABASE_WRITER_DRIVER_ADAPTER` | control-plane writer
|
| `CONTROL_PLANE_DATABASE_REPLICA_DRIVER_ADAPTER` | control-plane
replica |
| `RUN_OPS_DATABASE_WRITER_DRIVER_ADAPTER` | new run-ops writer |
| `RUN_OPS_DATABASE_REPLICA_DRIVER_ADAPTER` | new run-ops replica |
| `RUN_OPS_LEGACY_DATABASE_WRITER_DRIVER_ADAPTER` | legacy run-ops
writer |
| `RUN_OPS_LEGACY_DATABASE_REPLICA_DRIVER_ADAPTER` | legacy run-ops
replica |
With every flag unset the construction path is byte-identical to today
(`datasources` URL + Rust engine), so this is inert until a flag is
turned on. Per-client granularity allows enabling the adapter only where
it's wanted.
## How
- Enables the `driverAdapters` preview feature on both schemas
(`@trigger.dev/database` and `@internal/run-ops-database`). This keeps
the **Rust query engine** — it does NOT add `queryCompiler` — so query
behavior, result types, and engine tracing spans are unchanged.
- A shared `buildDriverAdapterPool` builds each client's `pg.Pool` with
an explicit `max`, a bounded `connectionTimeoutMillis` (the
node-postgres pool otherwise waits unbounded on acquire), and an
`onPoolError` handler (an unhandled idle-connection error would
otherwise crash the process). Threaded through all four client builders
via a `useDriverAdapter` flag.
- Adds `@prisma/adapter-pg` + `@types/pg` to the webapp; `pg` is already
pinned at `8.15.6` (adapter-pg 6.x requires `pg < 8.17`).
## Connect-failure handling (the important correctness/security bit)
Under the adapter an unreachable DB no longer surfaces as
`PrismaClientInitializationError` / `P1001`; it becomes a `P2010`
"Database not reachable: <host>" (or a raw
`ECONNREFUSED`/`ENOTFOUND`-class error). Two handlers are updated so a
client on the adapter behaves like today:
- **`isInfrastructureError`** now recognizes those shapes (P2010 with a
connectivity message, and raw connectivity errno codes). Without this,
the DB **hostname would leak into API-client-facing errors** and the
failure would go unlogged. Security-relevant.
- **`isPrismaRetriableError`** treats the adapter's pool-acquire timeout
("timeout exceeded when trying to connect") as retriable, preserving the
`P2024` retry behavior the adapter otherwise drops.
## Evidence
Validated on an isolated stack that mirrors the production DB topology
(chained PgBouncers in front of writer + reader):
- **Behavioral parity:** raw-query results and Prisma error codes/`meta`
are byte-identical between the engine driver and the adapter across the
queried shapes (unique-constraint `meta.target`, record-not-found,
transaction-timeout, serialization-failure, etc.).
- **Feature matrix:** a full 380-project queue-ay pass shows no
adapter-caused regressions — pass/fail parity between adapter-off and
adapter-on, with the residual failures being pre-existing
known-failures/flakes common to both.
## Rollout / rollback
All flags default off; enable per client via env var, roll back by
unsetting and redeploying (no data migration). Recommended first target
is a single writer; enable one client at a time.
## Follow-ups (not in this PR)
- `$metrics`-based pool observability is removed under the adapter (the
Prometheus route + `db.pool.connections.*` instruments); the metrics
replacement (via `pg.Pool` counters) lands in a separate PR.
- Note for operators: on the adapter path, interactive-transaction
`maxWait` does not bound pool acquisition — `connectionTimeoutMillis`
does.
## Note on connection-string parameters
The adapter pool is built from the base DSN, so Prisma-specific DSN
parameters that node-postgres does not understand are not honored when a
client is on the adapter:
- **Prisma TLS spellings** (`sslaccept`, `sslcert`, etc.) —
node-postgres uses `sslmode`/`ssl` instead. Our production DSNs do not
use these Prisma-specific TLS params, but any deployment whose DSN
relies on them must be checked before enabling a flag.
- `pgbouncer=true` and `statement_cache_size` — effectively moot under
the adapter, which uses no persistent named prepared statements.
`connection_limit`, `pool_timeout`, and `schema` are handled explicitly
(passed as `max`/`connectionTimeoutMillis` and PrismaPg's `{schema}`
option).
refs TRI-13039
---------
Co-authored-by: Claude Opus 4.8 (1M context) <noreply@anthropic.com>
⚒️ Publish Worker (v4) / build (supervisor) (push) Has been cancelled
## Summary
Prisma expands `in` / `notIn` into one bind parameter per element, so
every distinct list
length is a separate prepared statement. Where the length tracks data
volume (a batch size,
a run-graph fan-out, a prior query's id set) one call site can mint
hundreds of them. Each
is used about once, but inserting it evicts an entry that was being
reused, so the cost
lands on unrelated queries sharing the pooler's statement cache. An
unbounded list also
risks the 65535 bind-parameter ceiling.
`boundedIn()` pads a filter list to the next power of two by repeating
its last element.
`IN` and `NOT IN` ignore duplicates, so results are unchanged, and a
call site drops from
one statement per length to at most `log2(cap)`. Applied to all existing
sites.
## Enforcement
Two oxlint rules require the helper: a list filter must be an inline
array literal or a
`boundedIn()` call.
- The first covers filters reached through `where` / `having` /
`cursor`, and deliberately
never descends into `data`, `create`, `update`, `set` or `equals`. A key
named `in` in
those positions is user data, not a predicate, and rewriting it would
corrupt what gets
stored or compared.
- The second covers bare filter objects passed to where-building
helpers, which the first
cannot see. It found five sites in the run-graph batch loaders that were
otherwise
invisible.
Both rules follow filters through the shapes they are actually written
in: conditional
expressions, logical-and objects, spread-conditional properties,
computed keys, and call
arguments. An array literal only counts as fixed-arity when nothing
spreads into it, since
`[...new Set(ids)]` has a runtime length. Twelve sites were hidden
behind those shapes
until the rules handled them.
Scoped to `in` and `notIn`. The scalar-list filters `hasSome` and
`hasEvery` compile to
`&& $1` and `@> $1`, passing the whole array as a single bind parameter,
so their arity never
reaches the statement text and there is nothing to bound.
Both rules are `error`, so new call sites fail CI. That ratchet has
already caught four
sites added by other PRs while this one was in review.
## Notes
`boundedIn` pads by repeating rather than with null: `x NOT IN (a, b,
NULL)` is never true,
so null-padding a `notIn` filter would silently return no rows. Lists
above 32768 are
returned unchanged so padding can never push a query past the parameter
limit.
Route modules reach the helper through `~/db.server` rather than
importing the database
barrel directly, since a value import of that barrel into a module that
also exports a React
component is only safe while dead-code elimination prunes it.
Measured on a local rig: 300 distinct list lengths produce 300 prepared
statements
unpadded, 10 padded. Verified end-to-end against a local stack with the
full task-suite
sweep, which surfaced no regressions.
## What
The internal tracing `ParentBasedSampler` in `tracer.server.ts` left
`remoteParentSampled` at its default of `AlwaysOn`. Any request arriving
with a `traceparent` whose sampled flag was set got recorded in full,
bypassing `INTERNAL_OTEL_TRACE_SAMPLING_RATE` entirely. Because the SDK
propagates its (always-sampled) trace context on calls back to the
platform from inside running tasks, the large majority of API server
spans inherited a sampled parent and ignored the divisor. The sampling
knob was effectively inert on the busiest service.
This registers a custom propagator
(`NonInheritingTraceContextPropagator`) that stops adopting the inbound
trace as the parent:
- `inject` still delegates to the standard W3C trace + baggage
propagators, so outbound propagation is unchanged.
- `extract` drops the parent span (`trace.deleteSpan`) while preserving
baggage, so every incoming request roots its own trace and the ratio
sampler applies uniformly.
`remoteParentSampled` is also set to the ratio sampler as a
belt-and-suspenders fallback, in case an inbound sampled parent ever
reaches the sampler another way.
Two effects: the divisor becomes effective on the API server, and the
API no longer stitches onto (and inflates) the propagated task-run
traces, which is where the very large, un-thinnable trace chains came
from. Rooting each request removes those chains rather than only
diluting them.
Only the internal APM trace pipeline
(`INTERNAL_OTEL_TRACE_EXPORTER_URL`) is affected. The user-facing
run-trace pipeline (`otel.v1.traces` -> ClickHouse) is a separate path
and is untouched. The only consumer of the global propagator's `extract`
is the OTel HTTP/Express auto-instrumentation, so the blast radius is
inbound-request trace shape.
## Evidence (local full-stack red/green, divisor 10)
A local OTLP/JSON sink counting spans; a driver fires N requests at a
real endpoint, each carrying a distinct sampled `traceparent`, then
counts how many spans/traces carry that run's marker.
| run | code | sent | kept traces | kept fraction |
| --- | --- | --- | --- | --- |
| before | unmodified | 500 | 500 | 1.00 |
| after | this PR | 500 | 67 | 0.134 |
| after | this PR | 2000 | 213 | 0.1065 |
Before: 100% of inherited-sampled requests kept, divisor ignored. After:
~10% kept (the divisor), converging on it at larger N. In every
after-run each kept request is a single self-rooted trace (kept spans ==
kept distinct traces), confirming the inherited chains are gone, not
just thinned. `typecheck` passes.
## Rollout / rollback
No flag. Behavior stays governed by the existing
`INTERNAL_OTEL_TRACE_SAMPLING_RATE`. Rollback is a straight revert with
no data migration.
## Notes
Internal dashboards that count raw span or request volume from this
pipeline will read lower once this ships. That is expected: those counts
were inflated by the bypass, not a real drop in traffic.
Latency/percentile monitors retain plenty of samples at the current
divisor.
refs TRI-13031
## What
A trigger request carrying a Unicode NUL (`U+0000`) in the **idempotency
key** or **debounce key** reached `prisma.taskRun.create()` and failed
the insert, so the caller got an opaque 500 and the run was never
created.
These two keys are stored in `jsonb` columns (`idempotencyKeyOptions`,
`debounce`), and Postgres rejects a NUL inside a `jsonb` value with
`SQLSTATE 22P05` ("unsupported Unicode escape sequence ... cannot be
converted to text"). This fix strips the NUL from both keys at the
single trigger-input chokepoint (`#buildEngineTriggerInput`), which
every trigger path flows through (single, batch item, mollified, and
drainer replay).
Stripping matches the existing precedent for run errors and task events.
It does not change dedup behaviour: the idempotency **dedup identity**
is the hashed key (a clean 64-char digest), computed independently of
the raw key we clean, so dedup keeps working exactly as before. For
debounce the key is used directly, so the cleaned key also becomes the
grouping key, an acceptable change for input that is already malformed.
## Why not payload / metadata / tags
Those are `text` columns fed by `JSON.stringify`, which escapes a NUL to
a safe escape sequence, so they do not hit this failure on the normal
JSON path. (A raw NUL in a `text` column throws a different code,
`22021`, and is not what triggers this issue.) The observed failures are
the `jsonb` `22P05` variant, which is only reachable via the two key
fields.
## Evidence
Red then green (containerTest, real Postgres): with the fix reverted,
triggering through the real service with a NUL in
`idempotencyKeyOptions.key` / `debounce.key` fails with the exact
`22P05` signature; with the fix, the run is created and the stored key
has the NUL removed.
Full-stack e2e (isolated stack, real HTTP): `POST
/api/v1/tasks/:taskId/trigger` with a NUL inside
`idempotencyKeyOptions.key` (`"acme<NUL>inc"`) and, separately,
`debounce.key` (`"grp<NUL>1"`):
- both returned `HTTP 200` with a created run (previously `500`)
- stored `idempotencyKeyOptions` = `{ "key": "acmeinc", "scope": "run"
}` (7 chars, NUL removed)
- stored `debounce.key` = `"grp1"` (4 chars, NUL removed)
- both runs render in the dashboard
Unit tests cover the helper (strip, no-op fast path, object-reference
reuse, null/undefined pass-through).
## Rollout / rollback
Server-only webapp change, no flag. Zero behaviour change for clean
input; only affects inputs that previously 500'd. Rollback is a straight
revert, no data migration.
## Known limitation
A raw NUL in a plain-string idempotency key (not created via
`idempotencyKeys.create()`) lands in a `text` column and throws `22021`
instead. That variant is not addressed here because stripping it would
change the dedup identity, so it warrants a separate decision. Not
observed in practice.
refs TRI-13030
📦 Preview packages (pkg.pr.new) / Build and publish previews (push) Has been cancelled
📚 Publish docs / publish (push) Has been cancelled
Implementing PlanetScale Insights improvement.
## Summary
Validating a schedule (creating or updating one through the API or the
dashboard, and deploying a project that declares schedules) looks up the
newest version of a task by slug. That lookup reads *every* version of
the task and sorts them to return one. A project gains a row per task on
every deploy, so the work grows with the project's age: the oldest
projects pay the most, and dev-mode redeploys make it worse. This was
picked because it was the largest single consumer of database time on
the schedules path, and the fix is a sort key with no index behind it.
## Fix
`BackgroundWorkerTask` is indexed on `(projectId, slug)`, which serves
the equality but not the `ORDER BY createdAt DESC`. Postgres seeks the
index, then bitmap-scans and top-N sorts the whole group to produce a
single row. Adding `createdAt` to the index lets it scan backward and
stop at the first row.
The same call site also selected all 21 columns, including five JSON
blobs, to read one field (`triggerSource`), so it now selects that field
alone.
## Benchmark
Local Postgres 17, 997,000 seeded rows / 748 MB, group sizes chosen to
match the distribution seen in production.
| Group size | Before | After |
| --- | --- | --- |
| 15,000 versions of one task | 11.118 ms, 1,510 buffers, 15,000 rows
scanned | 0.027 ms, 4 buffers, 1 row |
| 2,000 versions of one task | 2.081 ms, 1,455 buffers, 2,000 rows
scanned | 0.022 ms, 4 buffers, 1 row |
```
before: Limit -> Sort (top-N heapsort) -> Bitmap Heap Scan
after: Limit -> Index Scan Backward using BackgroundWorkerTask_projectId_slug_createdAt_idx
```
An ascending index scanned backward is enough here, so no descending
index is needed.
## Impact and risk
Real-world gain lands between the two rows above and scales with how
many deploys a project has accumulated. Projects with few deploys will
see little change, since there is barely anything to sort.
The new index costs noticeably more than the existing two-column one: 43
MB against 7.3 MB on the benchmark rig. Adding `createdAt` makes every
key unique, which defeats btree deduplication, so this is a real disk
and write cost rather than a rounding error. Writes to this table happen
at deploy time, not on the run path, so the write amplification is
acceptable. The existing `(projectId, slug)` index is now a redundant
prefix and could be dropped, but this PR keeps it so index usage can be
observed before removing it.
Behavior is unchanged: same predicate, same ordering, same row returned.
The narrowed select is the only code change, and the field it keeps is
the only one the caller read.
Deploy note: the migration is
`20260806100000_add_background_worker_task_project_id_slug_created_at_index`
and uses `CREATE INDEX CONCURRENTLY IF NOT EXISTS`, so it can be
pre-applied by hand before the deploy.
## Summary
`syncDeclarativeSchedules` runs on every background-worker creation
(every deploy, and every file save during `trigger dev`). It issued one
instance-delete per declarative schedule the current worker no longer
declares, in a loop, and the overwhelming majority of those deletes
matched zero rows. This collapses the loop into at most two set-based
statements and skips the instance delete entirely when the current
environment owns no instance of the schedule.
## Why so many, and mostly no-op
The loop runs once per entry in `missingSchedules`, which starts as
every DECLARATIVE schedule for the whole project across all its
environments (the query filters only by `projectId`). A schedule leaves
that set only when a declared task matches it by `taskIdentifier`
**and** the schedule already has an instance in the current environment.
That last clause is the amplifier. When a task's schedule has no
instance in the current environment, the create branch inserts a
brand-new `TaskSchedule` row with an instance for this environment
rather than adding an instance to the existing row. So the same
scheduled task, once it has run in dev and been deployed to prod, exists
as two separate schedule rows: one carrying a dev instance, one carrying
a prod instance.
On a dev worker sync of that project:
- the dev-instance row matches the declared task and is removed from the
set
- the prod-instance row has the same `taskIdentifier` but no dev
instance, so it stays in the set and gets `deleteMany(taskScheduleId =
prodRow, environmentId = dev)`, which matches zero rows
So every declarative task that has been synced in another environment
contributes one guaranteed no-op delete per sync, and the count scales
with (declarative tasks x environments), plus any leftover rows from
renamed or removed tasks. A project does not need to have dropped a
schedule to generate these; it just needs the same declarative tasks
present in more than one environment, which is the normal
develop-in-dev, deploy-to-prod case.
## Fix
The candidate schedules are already loaded with their instances, so the
branch is decided in memory:
- schedules with no instances (or only current-environment instances)
are removed in a single `taskSchedule.deleteMany`
- schedules that still have another environment's instance have only the
current environment's instance detached, in a single
`taskScheduleInstance.deleteMany`, and only when such an instance
actually exists
Behavior is unchanged (cascade delete still removes the instances of a
deleted schedule); the difference is statement count. A zero-row delete
writes no WAL and creates no dead tuples, so the removed work was pure
query and commit overhead.
Verified with a testcontainer test (red before, green after) counting
the emitted deletes across the no-op, batched-detach, and
schedule-delete cases, and end to end through `trigger dev`: three
declarative schedules created, surviving a re-sync, then two removed in
a single batched delete with the third preserved.
Debouncing with a `delay` longer than an hour did nothing at all.
The engine applied a server-side ceiling on how long a debounced run
could be pushed back, measured from the run's `createdAt` and defaulting
to one hour. A run is only pushed back while its new execution time
stays inside that ceiling, so a `delay` at or above it could never push
anything: the waiting run was released, the trigger started its own run,
and the next trigger repeated it. A `delay: "12h"` produced one run per
trigger, each correctly delayed by 12h, with no error raised and nothing
on the run to show the debounce key had been ignored.
The ceiling is now unset by default. A debounce key with no `maxDelay`
keeps collapsing triggers for as long as they keep arriving, which is
what the docs have always described. Self-hosters who want a bound can
still set `RUN_ENGINE_MAXIMUM_DEBOUNCE_DURATION_MS`.
That has a consequence worth stating plainly, so the docs now carry a
warning for it: with no `maxDelay`, a continuously triggered key never
executes. Set `maxDelay` when the work has to happen eventually.
**Failing fast on an unusable `maxDelay`.** A caller who sets `maxDelay`
no longer than their `delay` hits exactly the dead end described above,
so that pair is now rejected at trigger time instead of silently
behaving as if no debounce were set:
```
debounce.maxDelay (1h) must be longer than debounce.delay (12h). A debounced run is only
pushed back while it stays inside maxDelay, so with these values every trigger would create
its own run.
```
An unparseable `maxDelay` is rejected too, rather than quietly falling
back to no bound at all, and so is a `delay` given as a date rather than
a duration, which could never work because the value is re-applied on
every push.
The same check runs against a configured server ceiling, so a
self-hosted deployment that sets
`RUN_ENGINE_MAXIMUM_DEBOUNCE_DURATION_MS` gets the error rather than the
silent failure this PR is about. With no `maxDelay` and no configured
ceiling, which is the default, there is nothing to conflict with and
nothing is rejected.
The docs, the `TriggerOptions` JSDoc and the engine option all now state
that the room available to push is the gap between `delay` and
`maxDelay`. The run engine suite gains the case that motivated this:
four triggers on one key with a 12h delay now collapse to a single run.
Passing `debounce` in the per-item options of a batch trigger did
nothing when the items were an array. The option was accepted by the
types and by the API, then dropped before the request went out, so every
item created its own run instead of collapsing onto the debounce key.
Four public entry points were affected: `task.batchTrigger`,
`task.batchTriggerAndWait`, `tasks.batchTrigger`, and
`tasks.batchTriggerAndWait`. The streaming (async iterable) forms of the
same calls were already correct, as were `batch.trigger`,
`batch.triggerAndWait`, `batch.triggerByTask`, and
`batch.triggerByTaskAndWait`.
`useTaskTrigger` in `@trigger.dev/react-hooks` had the same silent drop
on the single-trigger path, so that is fixed here too. It also drops
`machine`, `priority`, `region`, `idempotencyKeyTTL`, and
`idempotencyKeyOptions`; those are left alone, since forwarding them is
a behaviour change beyond this bug.
Each batch item builder constructs its options field by field, which is
why one of them could fall behind without anything catching it.
TypeScript did not help: the literal is returned from a `.map` callback
inside `Promise.all`, so excess-property checking never fired against
the `BatchItemNDJSON[]` annotation, and the server's schema silently
strips unknown keys. A misspelled option name therefore reproduced this
bug with no compile error and no server error. Every builder now ends in
`satisfies BatchItemNDJSON`, which does catch it:
```
error TS2561: Object literal may only specify known properties, but 'debounceTYPO'
does not exist in type '{ ... debounce?: {...} | undefined; }'.
Did you mean to write 'debounce'?
```
The new test drives all six public batch surfaces in both array and
async-iterable form and asserts on the NDJSON that actually reaches the
wire. Each item carries a distinct debounce key so the test catches a
wrong item-to-option pairing, not just a wholesale drop.
Fixes#3304
## Summary
Adds a docs page for developers who already have a working Vercel AI SDK
chat app (`useChat` on the client, an `app/api/chat/route.ts` calling
`streamText`) and want to move it to `chat.agent`. There was no page
covering that path. `ai-chat/upgrade-guide` reads like it should be the
one, but it covers moving prerelease `chat.agent` code to the Sessions
release, which is a different reader.
The page is structured around what stays, what goes, and what is new,
because the reassuring part of this migration is how much is untouched:
the `streamText` call, model config, tool definitions, `useChat`, and
all message rendering carry over as-is. What gets deleted is the route
handler, the persistence glue wired into it, and any resumable-stream
setup. What is new is the agent task, two server actions, and
`useTriggerChatTransport`.
Covers moving tools onto the agent config so `toModelOutput` survives
past turn one, where existing database persistence goes
(`hydrateMessages` plus the turn hooks), a short section on what
durability you get once you are across, a note that
Hono/SvelteKit/Express follow the same shape, and a gotchas list built
from the mistakes this specific migration produces.
## Head Start
The one thing this migration makes worse is the opening response of a
new chat. The route handler answered out of a warm process; the agent
run has to be dequeued and booted first. That is the complaint the page
has to answer head on, so Head Start gets a full section rather than a
closing aside, plus a callout up top next to the "what changes" table so
nobody plans the migration without knowing it exists.
The section walks the four steps: splitting tool schemas away from tool
executes (the bundle-isolation constraint the whole feature rests on),
building the handler, mounting it back at `app/api/chat/route.ts` with
the original auth check wrapped around it, and the transport option.
Both server actions stay, because Head Start only owns the first turn.
Three gotchas go with it: a slow first turn without Head Start, Head
Start on but the route bundle still heavy, and the route timing out
because the handler holds the SSE response open for the whole turn
rather than just step 1.
The coding-agent prompt names Head Start as explicitly out of scope, so
an agent handed the migration does not attempt the tool split
unprompted.
Also fixes the `chat.headStart` example on `ai-chat/fast-starts`, which
set `stopWhen: stepCountIs(15)` after the spread.
`toStreamTextOptions()` pins `stopWhen` to `stepCountIs(1)`, so
overriding it makes the warm handler run steps the agent is supposed to
own (and `stepCountIs` was never imported in that snippet either).
## Migration prompt
The page also ships a copy-pasteable prompt for handing the migration to
a coding agent. It tells the agent to run `npx trigger.dev@latest
skills` first, so it picks up guidance version-pinned to the SDK
actually installed in the project, then read `quick-start.md`,
`frontend.md`, and `reference.md` (with `llms.txt` as the index) before
editing anything. The instructions are explicit about preserving the
existing model, prompt, and tool schemas rather than rewriting them.
Registered in `docs.json` under Agents, directly after Quick Start, so
it is picked up by the generated `llms.txt` and the per-page `.md`
variants.
## What
Rate-limit the API by **environment** rather than per API key.
Previously the limiter keyed its bucket on the hash of the full
`Authorization` header — one bucket per key. With additional environment
API keys (`tr_*_sk_*`), an environment can mint many keys and each got
its own full bucket, so more keys = higher effective rate limit. This
collapses all of an environment's keys onto a single shared
per-environment bucket, so the ceiling is exactly the configured limit
regardless of key mix.
## How
- `authorizationRateLimitMiddleware` now lets the override return `{
config?, identifier? }`. `identifier`, when present, is the rate limit
bucket key; otherwise it falls back to the hashed `Authorization` header
(unchanged legacy behavior, still used by `engineRateLimiter` and any
unauthenticated fallthrough).
- `apiRateLimiter`'s override resolves the environment id and uses it as
the identifier:
- **Additional keys** (`isAdditionalApiKey`) resolve via a new
`resolveAdditionalApiKeyRateLimitScope()` — a **scope-agnostic** keyHash
→ (environmentId, org limiter config) lookup. It is deliberately
permissive (restricted keys resolve too) because it's used **only for
bucketing, never as an auth decision** — request auth still goes through
the RBAC bearer controller, which enforces scopes. Revoked/expired keys
are excluded so they can't hold a bucket warm.
- **Root/legacy keys** reuse the environment already resolved by
`authenticateAuthorizationHeader` and key on `environment.id` too.
- The identifier is always the stable environment id, never the secret
key (which can rotate and would split the bucket).
- The whole override result is cached per key by the existing SWR cache,
so **no extra per-request lookup and no separate Redis mapping** is
added.
## Behavior notes
- Root + additional keys of the same environment now share one bucket
(ceiling = configured limit, not a multiple of it). Restricted
additional keys are included — they were the biggest gap, since they
authenticate via the RBAC controller and previously fell back to per-key
buckets.
- **Public JWTs** keep their existing fixed-window, per-token bucketing.
- One-time bucket reset on deploy (bucket keys change); harmless.
## Tests
- New: two tokens resolving to the same identifier share one bucket.
- New: with no identifier, bucketing stays per-key (legacy behavior
preserved).
- Updated existing override tests to the new `{ config }` return shape.
Base: `feat/multi-keys-surface`. Closes TRI-12888.
## Summary
Projects can create, inspect, expire, and revoke multiple API keys for
each environment. Plaintext values are shown only at creation; stored
credentials are hashed and the API keys page displays only an obfuscated
suffix afterward.
Self-hosted installations support full-access additional keys by
default. Authorization extensions can provide additional access presets
and optional task selection. Additional keys can also mint scoped public
access tokens through the Trigger.dev API without receiving the
environment signing key.
## Feature notes
- Only admin+ can create API keys (Developer can make in Development
branch).
- JWT self-signing will be a server call when used with new `_ak_` keys.
- JWTs with long expiry can keep working even with api key deleted (gets
priveleges from api key, signed with root key)
- Unfiltered session listings intentionally preserve the existing broad
task-read behavior. Filtered listings enforce task-level scopes for
every requested task.
- Buffered runs without a task identifier are not safely authorizable,
so cancel/replay requests fail closed rather than resolving an unscoped
run.
- Batch and waitpoint endpoints intentionally return server-minted,
narrowly scoped public tokens to all callers. These tokens have bounded
lifetimes and may remain valid until expiry after API-key revocation.
## Deployment notes
Deploy the management UI and public-token endpoint with new key creation
disabled. Enable creation for selected organizations after the
authentication path and released SDK have been verified, then expand
availability gradually.
Revoking an API key prevents new bearer requests and new token minting.
Public tokens already minted by that key remain valid until their own
expiration because they are signed by the environment signing key.
## TODO
- [x] Add "Created by" to the key table
- [x] Document that streamed batch ingestion is non-atomic and may
partially accept items before a validation or authorization error.
## Follow-ups
- [x] Add an organization-level feature flag for the API key management
UI and creation action.
- [x] Document rollout ordering: enable additional-key lookup before
enabling issuance.
- [x] Add a system-wide gate that can stop new key issuance without
disabling authentication for existing keys.
- [x] Replace the generic SDK compatibility warning with the first
published compatible version. Old SDK will mint an unusable token if
given an `_ak_` key.
- [x] Add public documentation covering creation, storage, expiration,
revocation, SDK compatibility, and public-token lifetime behavior.
- [x] Add observability for key creation, revocation, policy preparation
failures, and public-token mint failures.
- [ ] Exercise create, copy-once display, authenticate, mint, expire,
and revoke flows end to end before broad enablement.
Adds a shared `pageMeta()` helper and 74 route declarations, so a title
reads `run_abc | Runs | Trigger.dev` — the specific thing first, then
the page. Org pages also carry the organization: `Team | Acme |
Trigger.dev`. Inside a project no scope is added, because the dashboard
switches projects in every tab at once.
Page names are unchanged; what's new is that a page says which one it is
at all. Three wording changes on purpose: the queue page now names the
queue, the model page names the model, and entity pages carry their
section.
## Findings addressed
- **Report bot edited the wrong comment.** The comment-lookup step
matched on the marker body text with no author predicate, so it would
silently PATCH a human's comment that happened to quote the marker
(GitHub gates comment editing on write access, not authorship, so it
never 403'd). Now constrained to `.user.login == "github-actions[bot]"`,
the same identity `helm-prerelease.yml` already pins.
- **A required check asserted facts about the whole webapp namespace.**
`webappSymbols.test.ts` asserted that nobody anywhere in `apps/webapp`
(walking locals, params, object keys) declares names like
`createJWT`/`updateEnvVars`, so an unrelated PR naming a local variable
failed a required check with a message pointing at nothing. Those
negative self-tests move onto a package-owned fixture tree; the positive
resolution assertions stay required (their absence rotted the tool
before) but now name the list to edit.
- **The suite ran twice on shared paths.** `obsmap` and `internal` path
filters shared four generic paths (`package.json`, both lockfiles,
`pr_checks.yml`), so any lockfile bump ran the observability-map suite
in both jobs. Dropped from `obsmap` (where `internal` already covers
them). The test that should have caught it only checked the package's
own source path; it now asserts the two filters' path intersection is
empty.
- **PR-comment footer** reworded: it said the report gates nothing,
which is true of the report but misled now that the tool's test suite
does gate webapp PRs. Names both failure directions and where to read
the rules.
- **Nightly corpus** comment corrected (stale entry count; the
failure-notification gap is documented, not silently implied).
## Review
Two adversarial reviewers ran over the diff; both findings were verified
and fixed: a hollow fixture assertion (a shared name satisfied either
walker branch — now one name per declaration form, revert-confirmed) and
a filter-intersection test that could be fooled by apostrophes in
comment prose (now strips comment lines first). Full package suite green
(877 passed), typecheck and format clean.
## Summary
On the run-ops store, creating a run could intermittently fail with a
"Transaction already closed" error, and the run would never be created.
Single-write run creates no longer run inside an interactive
transaction, so a brief database write stall can't blow the transaction
budget and drop the run.
## Fix
The dedicated run-ops `createRun` / `createFailedRun` wrapped a single
nested `taskRun.create` in an interactive `$transaction`. Its default 5s
budget is wall-clock from `BEGIN`, so when a write briefly stalls the
transaction expires before the create completes and throws, even though
the statement itself is fast at the database.
A single-write create does not need an interactive transaction: Prisma's
implicit nested create is already atomic and holds no app-side budget,
so it now runs directly. Only the `triggerAndWait` path (run plus its
associated waitpoint, two writes that must commit together) keeps an
interactive transaction, now with headroom over the default.
Verified with a red/green test against the real split topology
(reproduces the exact expiry on the unchanged code, green after) and an
end-to-end run created and completed through the dedicated store.
## Summary
Follow-on to #4513. The database connect timeout is now honored, but a
single global value has to serve three separate databases at once
(control-plane, legacy run-ops, and run-ops). This adds optional
per-client overrides for the Prisma pool and connect timeouts, one pair
for the writer and one for the read replica of each of the three
databases, each falling back to the shared `DATABASE_POOL_TIMEOUT` /
`DATABASE_CONNECTION_TIMEOUT` when unset.
That lets one database's clients run a fail-fast connect timeout (with a
bounded pool wait) while another keeps more headroom, without a single
knob forcing the same tradeoff everywhere. No behavior change until an
override is set.
It also tags each client's queries with its specific datasource
(`control-plane` / `legacy-run-ops` / `run-ops`, writer or replica) via
the `db.datasource` span attribute, so telemetry can attribute
connection behavior to a specific database instead of just
writer-vs-replica.
## Summary
Allow projects using TypeScript 7 to enable `emitDecoratorMetadata()`
without adding the TypeScript 6 compiler to every Trigger.dev CLI
installation. Addresses #4500.
## Fix
The extension now resolves TypeScript from the project and
feature-detects the legacy compiler API. TypeScript 5 and 6 continue
using the project's compiler, while TypeScript 7 projects can install
Microsoft's optional `@typescript/typescript6` compatibility package
alongside TypeScript 7.
When no compatible compiler API is available, the build reports an
actionable installation error. The extension documentation includes
setup commands for npm, pnpm, and Bun.
Verified with TypeScript 5, TypeScript 6, TypeScript 7 with and without
the compatibility package, emitted decorator metadata, packed ESM and
CommonJS consumers, package export checks, and typechecking.
## Summary
Triggering a run with a very large `priority` could fail run creation
outright with an opaque database error. `priority` is multiplied by 1000
and stored in a 32-bit integer column, with nothing bounding it, so a
big enough value overflowed the column and the create failed. The
trigger now caps the value to the highest supported priority instead of
erroring, so the run is still created.
## Fix
`priorityMs` (the stored `priority * 1000`) now goes through a
`clampPriorityMs` helper before the write. It rounds to a whole number
and clamps into the column range at both ends, so only a valid integer
ever reaches the column and an out-of-range priority caps rather than
failing. Single and batch triggers share the write path, so both are
covered.
## Summary
Every Prisma client built its connection URL with a `connection_timeout`
query param, but the Postgres connector's parameter is
`connect_timeout`. The misspelled param is silently ignored, so all
clients fell back to Prisma's 5s default instead of the configured
timeout. When establishing a new connection briefly took longer than 5s
(for example during connection spikes), it failed with `Can't reach
database server` even though the database was healthy.
## Fix
All four client builders now construct their connection URL through one
shared helper (`buildPrismaConnectionUrl`) that sets `connect_timeout`,
so the configured value actually applies, and the parameter name lives
in exactly one place. Covered by a unit test.
## Summary
Upgrade the monorepo to TypeScript 7.0.2 and update package build
tooling for compatibility with the native compiler.
## Design
Package builds now use `tshy` 4, while the packages still using `tsup`
move to `tsdown`. The few scripts that depend on the legacy TypeScript
compiler API use an explicit TypeScript 6 alias; declaration portability
coverage invokes the TypeScript 7 CLI directly.
Turbo is updated so workspace tasks can read the regenerated pnpm
lockfile.
---------
Co-authored-by: devin-ai-integration[bot] <158243242+devin-ai-integration[bot]@users.noreply.github.com>
A run controller must call the continue route to resume, so the
supervisor already knows synchronously that any checkpoint still running
for that run is pointless. It only acted on that for the compute path.
The continue route now cancels it for the Kubernetes path too, matching
what completion already does since #4493. Called after the reply so the
runner is never delayed, and skipped when there is no checkpoint client
or when the compute path owns the run. The request is bounded by a 5s
timeout so a hung call cannot leave the handler pending.
`checkpoint_cancel_requests_total{result}` records the outcome, using
the same label names as the delete path where they overlap: `sent`,
`no_client`, `not_applicable`, `http_error`.
No changeset: `CheckpointClient` is a server-only internal API, same as
#4493.
refs TRI-12915
A static observability scorer for the webapp's route entry points,
Lighthouse-style. The idea comes from evlog's `map` command, but that
tool has no Remix adapter and checks for its own logging API, so the
idea is ported rather than the tool.
It scans all 427 loader/action entry points in `apps/webapp/app/routes`
with the TypeScript compiler API and scores each against five checks:
error-classification, auth-boundary, auth-scope, request-context and
audit-trail. Current output on the real tree is **19/100** over 412
measured entry points.
```
cd internal-packages/observability-map
pnpm exec tsx src/cli.ts # terminal report
pnpm exec tsx src/cli.ts --json # machine output
pnpm exec tsx src/cli.ts api/v1/token # one entry, per-check detail
```
The two findings at the top of the fix list are real: `/auth/sso` and
`/api/v1/authorization-code` mint or exchange credentials
unauthenticated, and `/_app/orgs/:organizationSlug/settings/team`
resolves its org from a URL slug and gates each mutating branch on an
RBAC check alone, which per `apps/webapp/CLAUDE.md` is not the tenant
floor on self-hosted.
Decisions worth knowing, all with the reasoning in the README:
- The score started at 83 during development and fell to 19. Every drop
was a perverse incentive being removed, not a regression: routes were
being paid for having no error handling, two checks were reading the
same fact, suppressing a failure raised the score, and a no-op `catch
(e) { throw e }` was worth 50 points a route.
- **A mutation corpus is the tool's main defence.** 44 entries apply
semantics-preserving edits to a copy of the real route tree and assert
the score cannot rise, per route as well as globally, because a mean can
hide one route going up by taking another down. One entry runs as a live
expected failure: `try { String(0); }` with a deciding catch is a known
open hole worth 19 to 44, and it is disclosed rather than quietly
excluded.
- `audit-trail` and `request-context` are reported as headline figures
rather than one finding repeated hundreds of times. Both still count in
full where they should.
- A cohort change moves the number without anything in the codebase
getting better. Widening the sensitive cohort from 26 to 67 took the
global from 15 to 19 with no webapp change at all, so the report prints
per-check applicability and what the global would be without each one.
CI: a report-only job posts a sticky comment when a PR moves the report,
and says nothing when it does not. The package's own tests gate through
`pr_checks.yml`. The diff-scoped merge gate is still deferred until the
report has been used in anger.
524 tests plus the corpus. No runtime or dependency changes to anything
that ships.
<!-- GitButler Footer Boundary Top -->
---
This is **part 1 of 4 in a stack** made with GitButler:
- <kbd> 4 </kbd> #4485
- <kbd> 3 </kbd> #4484
- <kbd> 2 </kbd> #4483
- <kbd> 1 </kbd> #4455👈
<!-- GitButler Footer Boundary Bottom -->
When a run reaches a terminal state, ask the checkpoint service to
reclaim the storage its checkpoints occupied. Storage for finished runs
is not otherwise reclaimed, so nothing frees it today.
**Off by default** behind `DELETE_CHECKPOINTS_ON_COMPLETION`, and the
service-side handler ships separately, so merging this changes no
behaviour.
## Where the tenancy comes from
Addressing a run's checkpoints needs org, project, environment,
deployment version and run id. All five are already in hand at
`attempt.complete`, and three are **signed** by the deployment token:
| Value | Source | Trust |
| -- | -- | -- |
| org | claim `org_id` | signed |
| environment | claim `environment_id` | signed |
| deployment version | claim `deployment_version` | signed |
| project ref | `x-trigger-workload-project-ref` header |
runner-supplied |
| run | route param | runner-supplied |
`authorizeWorkloadRequest` previously returned only `environment_id`,
and only in enforce mode, so it now also returns the verified `claims`.
That difference is deliberate and documented on the method: claims are
used to address a run's **own** resources locally, never to scope the
platform, which is why `environmentId` stays enforce-only.
The two runner-supplied values are safe because the signed ones are
outermost - a runner lying about either can only name something inside
its own org and environment, and a project ref that doesn't pair with
its signed environment matches nothing. The run id is read from
`params.runFriendlyId`, the same value the platform just validated,
rather than from the body or a header. Where both a claim and a header
exist (`deployment_version`), the claim wins.
## Placement
The call sits after `reply.json(...)`, so the runner sees no added
latency - the same shape the suspend route already uses. The service
enqueues and returns 202, so it is one fast local hop.
Terminal means `RUN_FINISHED` **or `RUN_PENDING_CANCEL`** - a run
cancelled mid-execution never restores, and skipping it would leave its
storage behind. Retries are excluded deliberately: reclamation is
per-run, so a retry is covered by the final completion.
Also gated on `!snapshotService`, so it stays inert where checkpoints
aren't the kind this reclaims.
## Observability
`checkpoint_delete_requests_total{result}` counts `sent` **and every
reason we decide not to send**: `disabled`, `not_terminal`, `no_claims`,
`no_project_ref`, `http_error`.
The negative labels are the point - without them, "no requests are
happening" looks identical to the feature being switched off.
`no_claims` is reachable even under enforcement, since enforce only
rejects a *present-but-invalid* token; an absent or legacy id still
passes with no claims attached.
## Notes for review
- **No changeset**: `CheckpointClient` is `core/v3/serverOnly`, an
internal service-to-service API rather than customer-facing surface.
- **No `.server-changes/` note**: there is nothing a dashboard user
would notice here. Happy to add one if you disagree.
- `pnpm run typecheck` can't complete in my checkout -
`@trigger.dev/database` fails to build on a missing `tsc` in the pnpm
store, unrelated to this diff. Verified with `tsc --noEmit` against the
supervisor project instead: **zero errors in `apps/supervisor/src`**.
Worth noting it caught a real bug here - the completion response is
wrapped, so the status is `data.result.attemptStatus`.
refs TRI-12789
Adds System Preferences, Dark and Light themes, gated by the
`hasThemeSwitcher` feature flag (off by default — dark stays the default
theme for everyone).
Old theme is now "Classic"and set as default.
"System preferences" theme has both Light and Dark modes and uses your
laptop settings to use a correct one.
It has less color accents (specifically less colored text), and they are
the same for both modes, only grayscale values change between them. And
Light/Dark themes can be used separately.
New Contrast setting is available for System Preferences, Dark and Light
themes - it changes the contrast for the whole app. All new visual
Settings live in Account.
## Summary
The webapp's server bundle imports `prop-types` directly, but the
package was declared only as a `devDependency`. A production install
therefore leaves it out and the built server fails to boot:
```
Failed to start server: Error [ERR_MODULE_NOT_FOUND]: Cannot find package 'prop-types'
imported from /triggerdotdev/apps/webapp/build/server/assets/server-build-*.js
```
Moving it to `dependencies` is the whole change.
## Why the bundle imports it
Nothing in the webapp's own code uses `prop-types` — there is no
reference to it, or to `PropTypes`, anywhere under `apps/webapp/app`. It
arrives through `recharts`, whose `react-smooth` dependency still
declares `propTypes` on its components.
That was invisible until recently. While `recharts` was resolved at
runtime, its `prop-types` import was satisfied inside `recharts`' own
dependency tree, which is production all the way down. #4486 added
`recharts` and `victory-vendor` to `ssr.noExternal` to fix a hydration
mismatch on every server-rendered chart; that inlines `react-smooth`
into the server bundle, which moves its `prop-types` import into the
webapp's own resolution scope — where the package was not available in
production.
So the bundling change was correct about *which* d3-shape build both
sides resolve, and wrong about what the production runtime would be able
to find.
## Verification
`docker/Dockerfile` builds the runtime dependencies with `pnpm install
--prod` against a `turbo prune --scope=webapp --docker` output, so I
reproduced exactly that: pruned the workspace, installed with `--prod`,
and imported `prop-types` from `apps/webapp`.
| | result |
| -- | -- |
| `main` as it stands (devDependency only) | `FAILS:
ERR_MODULE_NOT_FOUND` |
| with this change | `prop-types resolves OK` |
It resolves both as a CommonJS `require` and as an ESM `import`, which
is the form the bundle uses.
I also checked this is not one symptom of a wider problem: of the 169
bare specifier roots the server bundle imports, `prop-types` is the
**only** one that is a devDependency and not a production dependency.
The rest are node builtins or production dependencies.
The hydration fix from #4486 is unaffected — the rebuilt bundle still
carries the rounding d3-path build.
## Notes
`prop-types` is inert in production (its entry point swaps in
`factoryWithThrowingShims`), so this adds a 124 KB package that does no
work at runtime. It has to be resolvable regardless, because the import
is real.
An alternative would be adding `prop-types` to `ssr.noExternal` so it is
inlined and needs no runtime resolution. That keeps the dependency list
honest about the fact that the webapp itself does not use it, at the
cost of bundling a CommonJS package into the ESM server output. This
route is the smaller, better-understood change.
Worth following up separately: a check that every bare import in the
server bundle resolves from a production install would have caught this
before it landed. Local development installs every devDependency, so the
gap is invisible when the built server is run from a working tree.
The dequeue brake released the moment its signal became unreadable.
`refresh()` caught any error from `source.read()` and set the verdict to
`null`, which `computeEngaged()` treats as not-engaged — so a few failed
reads dropped an engaged brake, silently, with no log and no metric.
That handling was symmetric while the risk is not. A source that has
stopped answering correlates with the pressure the brake exists for, so
releasing on read failure gives up protection at exactly the wrong
moment; holding too long only costs throughput.
Now a failed read keeps the last verdict instead of discarding it. The
verdict then ages normally, so the existing `maxVerdictAgeMs` check
becomes the grace window and still bounds how long a dead source can
hold the brake — a permanently unreachable source releases it rather
than pinning dequeuing forever. Because `computeEngaged()` only consults
staleness for an *engaged* verdict, a released one is unaffected and
stays released.
The default grace moves from 15s to 120s, comparable to how long the
brake normally stays engaged.
One guard worth calling out: holding is only safe when something bounds
it, so when `maxVerdictAgeMs` is unset the previous discard behaviour is
kept. Otherwise an unbounded hold could pin the brake indefinitely.
Read failures were previously invisible — the catch block neither logged
nor counted. Adds a `read_failures_total` counter, plus an error log on
the transition into failure rather than once per tick, since the refresh
loop runs every second.
The post-release ramp needs no change: it anchors off the
engaged-to-released transition, so a grace-window release still ramps
back up instead of snapping to full rate, which is what you want after a
blind period.
Tests cover holding while reads fail, releasing past the max age, and
the existing unbounded-config paths are unchanged.
## Summary
Self-hosted Kubernetes deployments can now add tolerations to run pods,
so runs
can schedule onto tainted nodes. Previously the only way to do this was
to patch
the supervisor.
`KUBERNETES_RUNNER_TOLERATIONS` takes a comma separated list of
`key=value:effect`, or `key:effect` to tolerate any value. It applies to
every
run pod, and for runs from a schedule tree it merges with the existing
`KUBERNETES_SCHEDULED_RUN_TOLERATIONS`. Left unset, nothing changes: no
tolerations are added and the pod spec leaves the field off entirely.
The Helm chart takes it as a list:
```yaml
supervisor:
config:
kubernetes:
runnerTolerations:
- dedicated=runs:NoSchedule
- spot:NoExecute
```
## Naming
The issue proposed `KUBERNETES_WORKER_TOLERATIONS`. This ships as
`KUBERNETES_RUNNER_TOLERATIONS` instead, because `RUNNER_*` is already
the prefix
for run pod settings (`RUNNER_HEARTBEAT_INTERVAL_SECONDS`,
`RUNNER_ADDITIONAL_ENV_VARS`, and `DOCKER_RUNNER_NETWORKS` for the
Docker
equivalent), whereas "worker" refers to the supervisor itself throughout
this app.
## Validation
Keys and values are checked against the Kubernetes naming rules when the
supervisor starts, so `dedicated=prod runs:NoSchedule` fails immediately
with a
message naming the offending entry. Without that check a bad value is
accepted at
startup and then rejected by the API server on every pod create, which
stops all
runs with the cause buried in an API error.
`KUBERNETES_WORKER_NODETYPE_LABEL` is
trimmed and validated for the same reason: surrounding whitespace is not
valid in
a label value, so a padded value fails every pod create today.
## Node selector off switch
`KUBERNETES_WORKER_NODETYPE_LABEL` accepts an empty string to skip the
node
selector entirely, so runs schedule on any node. This already worked and
the Helm
chart has always shipped it empty, but it was not documented. It is now.
The issue also asked for general node affinity configuration. That is
not
included: the node selector off switch plus tolerations covers the
reported
problem, and a free form affinity setting is a much larger config
surface to
commit to.
Fixes#4458
## Summary
The four charts above the queues table aggregated over **at most the 25
queues on the current page**. They reused the loader's already-paginated
queue array as a ClickHouse `queue IN (...)` filter, so paging or
re-sorting changed the values, and a name search matching nothing
blanked the whole chart row. The stat tiles above them were already
environment-wide, so the two rows disagreed.
They now read `env_metrics`, the environment-level rollup that already
exists for exactly this (the built-in Queues dashboard and the health
report read it). That is both correct and queue-count-independent: no
`GROUP BY queue` across an entire environment, and no client-side
summing.
Note this is not only a paging artifact: page 1 under-reported too. On
the seeded environment below, page 1 read 82% saturation against a true
87%, because the environment's running total is not the sum of one page
of per-queue gauges.
Three related fixes ride along.
**Scheduling delay and throttling sawed to zero.** Both are
event-driven, so at the 10-second bucket a short range picks, most
buckets hold no samples at all and were drawn as `0ms`. Measured over a
1-hour window: **232 of 349 buckets had no scheduling-delay samples**. A
bucket where nothing started is not a bucket where nothing waited, so
the line was both ugly and wrong. TRQL grows a `minBucketSeconds` floor,
plumbed through the metric resource route, and the hero tiles set 60s.
Buckets that still have no samples render as a gap instead of a dive to
zero.
**The floor must not feed a width-dependent headline.** Two of the four
headlines are not peaks, so widening the plotted buckets moved them:
- **Throttled** is a share of buckets that saw any throttling, so a
single brief throttle came to mark a whole minute instead of ten
seconds: the same seeded events read 17% at 10s and 85% at 60s.
- **Scheduling delay p95** is a percentile, and merging quantile states
over a wider bucket yields a p95 between the sub-buckets' own. Two 240s
samples among twenty in one 10-second sub-bucket give a worst-of-six p95
of 240,000ms against a merged 60-second p95 of 5,000ms — a 48x
understatement of a headline whose tooltip claims it is the worst in the
window.
Both charts keep the floor, since a readable line was the point of it.
Their headlines now come from a second query at the range's natural
bucket width, via an optional `readout` on the tile, so each means what
its tooltip says regardless of how the plotted buckets are sized.
Saturation and backlog are genuinely width-invariant (a max of maxes is
the same at any width), so they are unchanged and issue no extra query.
Both caught by Devin in review; I had wrongly lumped p95 in with the
peaks.
**Charts reported a hydration mismatch on every render.** Recharts
resolved victory-vendor's CJS entry on the server and its ESM entry in
the browser. Those bundle different d3-shape builds, and the CJS one
predates d3-path's digit rounding, so every server-rendered curve
carried full-precision coordinates while the client rounded to 3
decimals:
```
Server: M0,3C0.9305555555555555,3,1.8611111111111112,3,...
Client: M0,3C0.931,3,1.861,3,...
```
Bundling recharts for SSR makes both sides resolve the same ESM build.
Verified: 45 of 45 server-rendered chart curves now match the client,
and the page loads with an empty console.
## Verification
An isolated stack with 40 seeded queues (20 heavily loaded, 20 idle) and
90 minutes of 10-second buckets written into `queue_metrics_raw_v1`, so
the real materialized views built `queue_metrics_v1`, `env_metrics_v1`
and the 5m rollup. Ground truth for the environment: 260 running against
a limit of 300 (**87% saturation**), 800 queued.
| | before | after |
| -- | -- | -- |
| Saturation, page 1 | 82% peak | **87% peak** |
| Saturation, page 2 | 5% peak | **87% peak** |
| Backlog / delay, page 2 | "No activity" | **800 peak / 59.5s** |
| Name search matching nothing | all four charts blank | charts stay
environment-wide |
| Metric refetches on a page change | 4, each painting a skeleton | **0,
no skeleton** |
| Buckets drawn as 0ms with no samples | 232 of 349 | **0** |
| Throttled readout | 17% | **17%**, unchanged by the wider buckets |
| Worst-p95 readout source | plotted buckets | **natural width**, so a
sub-minute spike is not averaged away |
| Crosshair reach, hovering one detail-page chart | 2 of 4 others | **4
of 4** |
| SSR chart curves mismatching the client | 45 | **0** |
The bucket floor was measured across ranges: it widens 10s to 60s at 30m
and 1h, and is correctly a no-op at 12h (300s) and 7d (3600s). One extra
request per page load, for the throttled readout.
The built-in Queues dashboard, which reads `env_metrics` independently,
agrees at 86.7% and 260 of 300.
`internal-packages/tsql` suite green (612 tests), including 5 new ones
for the floor that fail without it. Webapp typecheck, oxfmt and oxlint
clean. Spot-checked the Run metrics dashboard and the per-queue detail
page for SSR regressions from bundling recharts: both render, console
clean.
The queue detail page carries the same event-driven series, so its
scheduling delay, throttling and per-key mean delay take the same
treatment.
## Screenshots
<img width="2540" height="580" alt="after-page1-charts"
src="https://github.com/user-attachments/assets/6cd23f9c-e7fd-4918-bcfa-b1d3340b16d1"
/>
## Rollout
Already behind the per-organization `queueMetricsUiEnabled` flag, so
only gated orgs see any of it. Blast radius is chart values on one page
plus the SSR bundling of recharts; rollback is a revert with no data
migration.
## Stated limitations
- `wait_ms_count` and the quantile state both only count `wait_ms > 0`,
so "nothing started in this bucket" and "everything started instantly"
are indistinguishable in storage. Both render as a gap. Distinguishing
them needs a schema change, which is not in this PR.
- The queue name search deliberately no longer narrows the charts. It
only did so incidentally and incorrectly before (first 25 matches, and
blanked on zero matches). Search-scoped charts would need the full
unpaginated matching set and a server-side aggregate; worth its own
ticket if we want it.
- Bundling recharts for SSR grows the server bundle slightly. That is
the cost of both sides resolving one d3-shape build.
- The plotted delay line is a smoothed 60-second view, so a sub-minute
spike above the one-minute warning threshold can fail to colour the line
even though the headline reports it and colours itself.
- Every chart inside one synced group shares the floor, because the
hover crosshair is a reference line on a category x-axis and only draws
where the hovered bucket exists in the other chart's own data. That
costs the queue detail page's gauges some resolution (1 minute instead
of 10 seconds) in exchange for the crosshair working across the row.
Separately, while taking the screenshots I found a pre-existing
rendering bug unrelated to this change: a **perfectly flat** saturation
series draws no line at all (the readout still shows the right
percentage), which looks like the threshold gradient's offset
degenerating when the series min equals its max. It reproduces on
`main`, so it is not a regression here and I have left it alone; filed
as its own issue.
Refs TRI-12784
GET /api/v1/reports/health threw `no catalog registered for report
"health"` in production (fine in dev): the catalog registered itself as
a side effect of a bare import, which the SSR build tree-shakes under
`"sideEffects": false`. Verified on the built server bundle — main's is
missing the catalog, this branch's carries it.
Fix: catalogs are values on the report registry entries; the resolver
reads them from there and the mutable register-at-import step is gone.
## Summary
Environment API keys backed by the additional-key table can authenticate
API requests using their stored effective scopes. Revoked and expired
keys are rejected, branch environments retain their existing routing
behavior, and last-used timestamps are updated on a throttled
best-effort basis.
## Design
API route builders receive the resolved ability and reject restricted
keys on routes without an authorization declaration. Existing
deployment, environment variable, queue, run, task, batch, session, and
waitpoint routes declare the resources they access.
Trigger and batch responses return server-signed public access tokens,
so additional keys never need access to the environment signing secret.
Root-key rotation also keeps public tokens valid for the existing grace
window.
## Feature notes
- Root environment keys remain unrestricted for backward compatibility.
Additional keys enforce their persisted scopes and fail closed on routes
without an authorization declaration.
- Machine-key requests never exchange one credential for another.
Additional keys cannot retrieve the root key, and rotated root keys are
not upgraded
during their grace window.
- Public JWT validation remains host-owned, while installed RBAC plugins
continue to supply root-key abilities.
- Unfiltered session and run listings preserve existing broad task-read
behavior. Filtered requests enforce the supplied task identifiers.
- Related-run summaries remain embedded in run retrieval for API
compatibility. Retrieving or mutating a related run independently still
requires
permission for that run.
- Queue management authorizes at collection scope, matching the queue
permissions currently issued.
- Batch responses deliberately include server-signed public access
tokens for all clients. Selected-task credentials continue using their
original
credential for per-item authorization.
- Two-phase batches authorize declared task identifiers before creation
and authorize every streamed item. Streaming paths that cannot declare
the
complete task set remain fail closed.
- Authentication telemetry records successful credential resolution
separately from subsequent resource-authorization failures.
- API keys are high-entropy random tokens. SHA-256 is intentionally used
for deterministic indexed lookup, not password hashing.
## Deployment notes
The schema migration must be present before this code is deployed.
Because bearer resolution runs on every authenticated request, deploy
the resolver with additional-key lookup disabled, verify root-key and
public-token parity, then enable lookup before any additional keys can
be issued.
The multi-task authorization tightening changes the result for narrowly
scoped tokens that request tasks outside their grants. Observe
would-deny results before enforcing that check. Request-idempotency keys
are also newly isolated by environment and task, so a retry crossing the
deployment boundary may execute once more before old cache entries
expire.
## Follow-ups
- [x] Add a system-wide kill switch for additional-key lookup, defaulted
off for the initial deployment.
- [x] Add authentication observability by credential kind, result,
latency, and lookup path without recording credential values.
- [ ] ~Add would-deny observability and an independent enforcement
switch for multi-task authorization.~
- [ ] ~Add an independent switch for server-issued batch tokens while
root-key parity is verified.~
- [ ] Confirm every API route reachable by a restricted key has an
explicit authorization declaration or intentionally fails closed.
- [x] Verify root-key rotation, revoked-key grace, and public-token
validation through each bearer resolver path.
Restructures the Kubernetes self-hosting guide around two explicit paths
- an **evaluation install** (bundled datastores, one command) and a
**production install** (external datastores, your own secrets) - so
every configuration decision belongs to one path or the other instead of
being a flat list of options with caveats.
Also in this pass:
- Adds an architecture overview (component-to-`values.yaml` map) and a
post-install "verify it" step.
- Consolidates the previously scattered upgrade notes into a single
collapsible group, and cuts implementation detail and historical asides
that no longer apply.
- Removes a duplicated object-storage section (two configs in two
styles) and trims the Docker ClickHouse note down to what a self-hoster
needs to act on.
## Summary
The Queues list and queue detail pages opened on a 1 day window, and
went back to it every time you navigated between queues or reloaded.
They now default to the last hour, and the period you pick is remembered
across navigations and refreshes.
## Design
The last period is stored in a `queueMetricsPeriod` cookie, written
client-side whenever a `period` lands in the URL and read by both
loaders. A cookie rather than localStorage because the queues list
renders its per-queue metrics columns server-side: with localStorage the
page would paint the 1 hour default and then re-fetch, and the picker
would flash the wrong window.
Both pages resolve the window once, in one place, and pass it down:
```ts
period: resolveQueueMetricsPeriod({
period: value("period"), // a usable period in the URL wins
from: value("from"), // an absolute range means "no period"
to: value("to"),
defaultPeriod, // otherwise the remembered default from the loader
}),
```
That keeps the picker pill and every chart query on the same value, so
no call site falls back to its own default. Periods the picker could
never produce (a hand-edited `?period=garbage`, or a window past the 30
day retention) fall back to the default, and the picker renders the
resolved window rather than the raw search param so the label can't
disagree with the data. Absolute from/to ranges, including drag-to-zoom,
are not remembered, since they would pin later visits to a window that
has gone stale.
While wiring that up: the two queue-metric queries that go straight to
ClickHouse (the list table and the concurrency-keys endpoint) never
applied the org's `queryPeriodDays` limit, so a hand-typed `?period=`
read further back than the plan allows. Everything behind
`/resources/metric` is already clipped that way by `executeQuery`; both
of these now clip with the same limit, capped at the retention window,
and the plan cap is resolved once per load and handed to the page
instead of each route deriving its own copy from the client-side
subscription.
Verified on both pages: default with no cookie is 1 hr, picking 6 hrs
survives navigating away and back to a param-free URL and a hard reload,
clearing the cookie returns to 1 hr, an oversized period falls back
without being remembered, and an absolute range still renders as a
range.
The Help & Feedback → "Contact us" form in the sidebar intermittently
failed to send. The `<Feedback>` dialog was nested inside the Help
popover, so clicking **Send** closed the popover and unmounted the form
mid-submit — canceling the `POST /resources/feedback` before it went
out. The message was silently lost (the success toast still shows). A
race, so it "worked sometimes"; the standalone "I'm stuck!" path was
unaffected.
**Fix:** host the Feedback dialog *outside* the popover (same pattern as
`AskAIRoot`) and open it from the menu item, so closing the popover no
longer tears down the form. `Feedback` gains an optional controlled
`open`/`setOpen` mode; existing `button`-triggered usages are unchanged.
## Changes
- `Feedback.tsx` — optional controlled `open`/`setOpen`; `button` now
optional.
- `HelpAndFeedbackPopover.tsx` — "Contact us…" opens a `<Feedback>`
hosted outside `PopoverContent`.
- `.server-changes/fix-sidebar-feedback.md` — user-facing note.
## Testing
Webapp typecheck passes. Sidebar "Contact us…" now sends on every
attempt (Network: `POST /resources/feedback` → `204`, never
`(canceled)`); "I'm stuck!" and the `?feedbackPanel=` open path
unchanged.
## Summary
The task, scheduled task and agent pages now name their runs table with
its own title bar, and the controls that page the table sit beside it
rather than in the bar at the top of the page. The top bar keeps just
the date filter.
Two agent page layout bugs are fixed along the way: scrolling a wide
runs table sideways dragged the charts off screen with it, and the
details panel stopped short of the bottom of the window.
## Fix
The charts moved because the runs table had no horizontal scroller of
its own. `stickyHeader` swaps the table's `overflow-x-auto` for
`overflow-visible`, so the overflow escaped up to the page scroll box,
and setting only `overflow-y-auto` on that box leaves the computed
`overflow-x` at `visible`, which CSS then promotes to `auto`. The chart
grid is a sibling inside that box, so it scrolled too. The table now
keeps its own scroller (the same rule the queues list already documents)
and the page box clips x so this cannot recur.
The short panel was a second `PageContainer` wrapping the agent routes.
`PageContainer` is `grid-rows-[auto_1fr]`, so a lone child lands in the
`auto` row and its `h-full` resolves against content height instead of
the viewport.
This also reverts the global tooltip `max-w-[230px]` introduced in
[#4131](https://github.com/triggerdotdev/trigger.dev/pull/4131), so
longer tooltips are no longer squeezed into a narrow column.
### Agent overview page showing table now scrolling
<img width="3452" height="1648" alt="CleanShot 2026-08-01 at 12 04
38@2x"
src="https://github.com/user-attachments/assets/ef1ac55d-8ffb-4278-983b-031ed21c1f55"
/>
## Summary
Self-hosted deployments now run ClickHouse from the official
[`clickhouse/clickhouse-server`](https://hub.docker.com/r/clickhouse/clickhouse-server)
image instead of `bitnamilegacy/clickhouse`. Bitnami's free image
catalog is EOL and the frozen legacy archive tops out at ClickHouse
25.7.5, below the 25.8 minimum the platform requires since v4.5.0, which
broke every ClickHouse insert on chart-bundled deployments. Both stacks
now default to 26.2, the same version the platform is developed and
tested against.
Existing deployments keep their ClickHouse data with no manual
migration.
Fixes#4197.
## Details
**Docker Compose**: the `clickhouse` service uses the official image
with its native env vars, plus the recommended `nofile` ulimits. It
reuses the same named volume as before: a `data-paths.xml` config
override points ClickHouse at the `data/` subdirectory of the volume,
which is exactly the layout the Bitnami image used, so old volumes work
in place (including SQL-created users) and fresh installs get the
identical layout. The service follows the required-secrets model:
`CLICKHOUSE_PASSWORD` must be set, matching the other services.
**Helm chart**: the Bitnami ClickHouse subchart is replaced by a
chart-owned single-node StatefulSet and Service running the official
image (non-root, HTTP `/ping` probes, config overrides mounted into
`config.d`, and the same `data-paths.xml` layout compatibility). On
upgrade, the chart automatically adopts the data PVC left behind by the
old subchart (`data-<release>-clickhouse-shard0-0`) via `lookup`, and
`fsGroup` relabeling handles the uid change on first mount. Both the
ClickHouse server and the webapp read the password from the same
chart-managed datastore secret (auto-generated and retained across
upgrades), so the server credential and the app's connection URL always
match. Existing `clickhouse.*` values keep working: `auth` (including
`existingSecret`/`existingSecretKey`), `persistence` (including
`global.storageClass`), `resources`, `secure`, `external.*`,
`configdFiles`, and now `nodeSelector`/`tolerations`/`affinity`.
Bitnami-only keys (`shards`, `replicaCount`, `keeper`,
`resourcesPreset`) are gone; default `resources` requests/limits match
what the old preset applied. The docs state the 25.8 minimum for
bring-your-own ClickHouse.
## Upgrade caveats
An adversarial review of the upgrade path found a few cohorts that need
awareness (all documented):
- **GitOps tools that render with `helm template`** (no cluster access):
PVC auto-detection can't run, so `clickhouse.persistence.existingClaim`
must be set to the old PVC name or ClickHouse starts on a fresh empty
volume. Documented in the values file and the Kubernetes self-hosting
docs. Tools that run real helm installs (e.g. Flux) adopt automatically.
- **A pinned `CLICKHOUSE_IMAGE_TAG`** pointing at a Bitnami tag must be
updated to an official image tag; documented in the Docker self-hosting
docs.
- **Storage without `fsGroup` support** (NFS, hostPath): set
`clickhouse.volumePermissions.enabled: true` for a one-time
ownership-fixing init container.
- **Rollback is not automatic**: once the official image has run, file
ownership changes and the Bitnami image can no longer read the volume
without a manual chown, and ClickHouse does not support downgrades
across the version gap.
## Verification
- Full upgrade simulation for Compose, twice (before and after rebasing
onto the required-secrets release): booted the ClickHouse service from
the old compose file on `main` (Bitnami), wrote thousands of rows, then
brought the same project up with this branch's compose file. The
official 26.2 server came up healthy on the same volume with all rows
intact, SQL-created users working, and writes succeeding.
- Adoption scenarios tested against real containers: old volume + root
entrypoint (Compose), old volume owned by the Bitnami uid + non-root 101
with fsGroup-style group permissions (Kubernetes), and fresh volumes for
both.
- `helm lint`, `helm template` (default values, `existingClaim` set,
external ClickHouse, volumePermissions/scheduling toggles, and the
production example) and kubeconform all pass, mirroring the release CI
steps. The rendered webapp Deployment and ClickHouse StatefulSet resolve
to the same datastore secret key.
- Inserts using
`input_format_json_infer_array_of_dynamic_from_array_of_different_types`
(the setting that fails on 25.7.5) succeed on the upgraded volume.
## Upgrade preflight and docs
A production upgrade report on this branch surfaced two hazards that
predate this PR — both landed in chart 4.5.6 (#4316) — so they are fixed
here rather than left for the next person to hit.
**`secrets.existingSecret` gained two required keys.** The webapp
started reading `PROVIDER_SECRET` and `COORDINATOR_SECRET`, and when
`existingSecret` is set the chart generates nothing, so a missing key
only surfaced as a `CreateContainerConfigError` partway through the
webapp rollout. The pre-install/pre-upgrade validation now looks the
Secret up and fails with the complete list of missing keys, leaving the
running release untouched. It is skipped under `helm template` and
client-side dry-run, where `lookup` cannot read the cluster.
**Bundled datastore credentials moved into the chart-managed Secret**
(`<release>-clickhouse`/`admin-password` →
`trigger-datastore`/`clickhouse-admin-password`). The chart wires both
ends itself, but consumers outside it — maintenance CronJobs, Grafana
datasources, secret syncs — have to be repointed. A new `## Upgrading`
section in the Kubernetes docs carries the old→new mapping, the two new
keys, and a pointer to the ClickHouse image notes.
The existingSecret key list in the docs also named
`OBJECT_STORE_ACCESS_KEY_ID`/`OBJECT_STORE_SECRET_ACCESS_KEY`, which are
env var names rather than keys the chart reads; corrected to the real
key names and the condition under which they apply.
Verified on a throwaway kind cluster with `--dry-run=server`: a
pre-4.5.6 Secret fails with both key names listed, the documented
`kubectl patch` clears it, and default values, `existingClaim`, external
ClickHouse, volumePermissions/scheduling and the production example all
still render. A real `helm install` followed by an upgrade against an
incomplete Secret aborts with the release still at revision 1 and
`deployed`. `helm lint`, the CI render and kubeconform (59 resources, 0
invalid) pass.
---------
Co-authored-by: nicktrn <55853254+nicktrn@users.noreply.github.com>
## Summary
A single run output, trace span, or payload carrying JSON that
ClickHouse can't ingest (for example nesting past its depth limit) used
to fail the whole insert batch, so unrelated runs and spans silently
disappeared from the runs list, traces, and logs. This keeps the rest of
the batch and handles the offending row instead of dropping everything
around it.
## Fix
Recovery is per-table, matched to what each table needs:
- **Runs** (`task_runs_v2`) keep their status. We follow ClickHouse's
failing-row hint to strip just the un-ingestable JSON column(s) so the
run still lands (its output reads from Postgres on the detail page), up
to a configurable limit (`RUN_REPLICATION_MAX_POISON_STRIPS_PER_BATCH`,
default `1`). Past the limit we stop and land the batch with
`allow_errors` in a single pass, skipping the remainder. Cost stays a
fixed handful of inserts no matter how large or poisoned a flush is.
- **Trace events and payloads** (high volume, append-only) recover with
a single `allow_errors` insert: the good rows land in one pass and only
the un-ingestable rows are skipped.
Before falling back, a lightweight sanitizer still repairs what it can
losslessly (lone UTF-16 surrogates, out-of-range integers) so a
repairable row lands in full.
To read the failing-row hint we patch `@clickhouse/client-common`: its
error parser truncates the server response and discards the `(at row N)`
position, so the patch preserves the full text for the recovery path to
read.
## Summary
Adds an admin-only "AI agent" storybook page exploring an animated
identity for the dashboard agent: a resting dot logo that animates while
the agent is thinking, then settles once it is done.
The lead experiment is a 5x5 dot matrix. Shapes are five-line string
bitmaps, a bright head walks each shape's route on a fixed beat, and it
only hands off between shapes on a dot the two share, so the rhythm
never breaks. It comes with 26 faces, six gradient palettes, and light
and dark treatments. Two earlier prototypes (a crisp logo that scatters
into orbiting dots, and a dotted triangle on tilted 3D orbits) are kept
in their own tabs for comparison. Everything is plain canvas code with
no new dependencies.
Also adds an `ask-ai` Button variant: secondary styling with a soft
trigger-green border and padding tuned around the leading logo. The
variant supplies the agent logo itself, so callers write `<Button
variant="ask-ai/small">Ask AI</Button>`. Passing a `LeadingIcon`
overrides it, which is how the thinking animation gets driven.
No release note: the storybook is admin gated and the button variant is
not used in product UI yet.
## Summary
Opening a filter sub-menu that has its own search field left the cursor
outside it, so you had to click into the field before you could type.
The cursor now lands in the search field every time a sub-menu opens.
`ComboBox` now focuses its input whenever the popover is open and the
field is present, so the cursor lands there both when a menu opens
normally and when a sub-menu mounts its field late. It is a no-op
wherever focus already worked.
Verified in the dashboard against the Tags menu: before, the field
mounted with focus still on the popover container; after, it mounts
focused and accepts typing straight away.
The pod-count backpressure source read
`apiserver_storage_objects{resource="pods"}` from an apiserver
`/metrics` scrape. That gauge is a periodically-refreshed cached count,
and it is served by whichever apiserver replica the scrape lands on —
replicas disagree with each other at the same instant, by enough to
swamp the engage/release hysteresis band. Engage and release timing was
therefore partly a function of scrape routing.
This replaces it with a single `limit=1` list of the workload namespace
and computes `remainingItemCount + items.length`. One pod object
transferred, no informer, no watch cache.
Two request-shape constraints are load-bearing and called out in the
code: passing a label or field selector makes the apiserver omit
`remainingItemCount` entirely, and setting `resourceVersion` serves a
cached count rather than a quorum read. Neither is passed.
`remainingItemCount` is only set when the list is truncated, so
`_continue` is the truncation signal — if it is absent the returned page
is the whole collection and `items.length` is already exact. If the list
*is* truncated and the count is missing or implausible, the fetcher
throws rather than guessing.
Failure semantics are unchanged: a throw lands in the monitor's existing
catch, exactly as the previous parse did. The hysteresis, verdict shape,
and gauge are untouched. RBAC is unchanged — the existing role already
grants `pods: list`.
The `/metrics` non-resource grant in the deployment role becomes unused,
and the scrape-timeout env var is now a slight misnomer. Both left alone
deliberately: the grant may be wanted again for other apiserver signals,
and renaming the var would need a coordinated config change for no
behavioural gain.
Tests cover the not-truncated, truncated, missing-count, negative-count
and timeout paths.
A non-delayed run used to get two execution snapshots the moment it was
triggered: `RUN_CREATED` nested in the run-create transaction,
immediately followed by `QUEUED` from its own `BEGIN`/`INSERT`/`COMMIT`.
It now gets a single `QUEUED` snapshot written inside the create, and
the trigger path only publishes to the queue. One fewer row per run on
`TaskRunExecutionSnapshot`, and one fewer round trip on the trigger hot
path.
`EnqueueSystem` gains a `publishRun` seam that enqueues without writing
a snapshot. Every re-enqueue path (waitpoint resume, checkpoint restore,
delayed enqueue, pending version, retry requeue) still calls
`enqueueRun` and writes its own `QUEUED`, so only the first enqueue
changes. The `QUEUED` snapshot still commits before the queue message,
so a dequeue sees a dequeueable status exactly as before.
Two things for reviewers. Nesting the write skips
`createExecutionSnapshot`, which is what emits
`executionSnapshotCreated` and therefore the run timeline's `[engine]
QUEUED` entry, so the trigger path now emits it directly, the same way
the dequeue and attempt-start paths already do for their nested creates.
And `RUN_CREATED` is still written when a dequeued run has no background
worker yet, so the status and both `statuses.ts` helpers stay live and
existing rows keep reading correctly.
Delayed runs are untouched: `DELAYED` then `QUEUED` are two genuinely
different moments and stay two snapshots.
Rollback is a revert. Create-and-enqueue happen in one request in one
process, so no in-flight run needs both code paths to agree during a
rollout.
One note for whoever debugs this path later. The `QUEUED` snapshot now
commits before the queue publish, so a failed publish leaves the run
recorded as `QUEUED` with no queue message. That state was already
reachable, since the publish was never part of the snapshot transaction,
but it used to be recorded as `RUN_CREATED`, which was distinctive
because it never otherwise persisted. `QUEUED` with no message is
indistinguishable from a run waiting on a concurrency slot, so
trigger-time publish failure is now one more cause of an apparently
stuck queued run.
## What
`startRunAttempt` — the run controller's first call when a run starts —
had no retry on transient connection errors. A brief connection blip on
that call would abandon the start and send the run back through the
queue, delaying its first attempt.
This adds a jittered backoff retry, matching the existing
`continueRunExecution` path with a shorter budget, so a transient blip
is ridden out in place instead of bouncing the run.
## Why a shorter budget
The continue path retries generously. Start-attempt keeps a tighter
budget (6 attempts, ~25-40s jittered) so it rides out a transient blip
but never keeps retrying past the point the run would already have been
requeued.
## Safety
Retrying is safe: start-attempt is guarded server-side by the snapshot
id — a retry after a start has already committed is rejected, so it can
never double-start an attempt. A pure connection error (the common case)
never reached the server.
## Scope
One retry-options object on `startRunAttempt`; no other behavior change.
Warm starts share this path and get the same resilience.
## Summary
`batchTriggerAndWait()` could leave a parent run waiting forever. The
2-phase batch API blocks the parent on the batch's waitpoint as soon as
the batch is created, but the batch is only sealed at the end of item
streaming. If streaming never completed, nothing sealed the batch,
nothing completed the waitpoint, and the parent stayed suspended with no
timeout and no way to recover.
Supersedes #4016, which added the reaper alone.
## Fix
Admission for item streaming was being decided twice. Batch creation
passes its own rate limiter, which fixes `expectedCount` and blocks the
parent, and then the item stream had to pass the general API limiter as
well, competing with unrelated traffic. A second limiter could therefore
veto work the first had already committed the parent to. Creation now
mints a bounded grant that the item stream spends, so an admitted batch
can finish streaming. The grant is capped per batch rather than
exempting the path, and every failure mode (no grant, spent grant,
unreachable store) falls back to the normal limiter.
That makes stranding much rarer but not impossible, since a request
timeout or a crash can still end streaming for good. So a seal-timeout
reaper aborts any batch still unsealed after `BATCH_SEAL_TIMEOUT_MS` and
completes the parent's waitpoint with an error, letting
`batchTriggerAndWait()` reject instead of hang. It is race-safe against
a late seal, and it is only scheduled for batches that actually block a
parent, so fire-and-forget batches cost nothing.
Finally, the batches page used to report "Batch completion checked." for
these batches while doing nothing, because the completion path returns
early on an unsealed batch. It now says the batch cannot be resumed.
Rate limiting is no longer the reason a batch strands, so the reaper's
default stays at 30 minutes, comfortably above the SDK's worst-case
stream-retry budget.
## Verification
Unit and container tests cover the grant cap, the bypass ordering (it
runs after the authorization check, so it can never skip
authentication), and the reaper's abort, seal race, idempotency, and
no-waitpoint cases.
Also verified end-to-end against a running stack. With the general limit
exhausted, batch creation and other API calls returned 429 while a
granted batch still streamed and sealed; an ungranted batch id was rate
limited rather than bypassed; and the grant cut off exactly at its
configured attempt count. Reproducing the stranded state on a real
parent run, the batch was aborted at the timeout, the waitpoint
completed with an error, and the parent resumed and finished instead of
hanging. A parentless batch left unsealed was untouched well past the
reaper window.
## Verified against deployed runs
The reaper was proven end to end with a real deployed run (locally-run
supervisor, containerised
run) and a real network fault, rather than a simulated one: toxiproxy
severs the phase 2 item
stream mid-flight so every SDK stream retry genuinely fails, while phase
1 still succeeds. Only
the batch calls traverse the fault, so control-plane traffic is
untouched.
The reproduction is the shape that actually strands a parent: the task
catches the
`BatchTriggerError` the SDK throws and carries on, so the phase 1 block
outlives the thrown error
and the parent hangs at its next suspension point.
With the reaper disabled, the parent sat in `EXECUTING_WITH_WAITPOINTS`
for over 24 minutes holding
two blockers, and stayed stuck across a full infrastructure restart:
```
type | status | has_timeout
BATCH | PENDING | f <- orphan, completedAfter NULL
DATETIME | COMPLETED | t <- the wait already elapsed
```
With the reaper enabled the same task under the same fault completed in
about 75 seconds with zero
blockers left, the batch `ABORTED`, and its waitpoint completed carrying
the error.
Two conditions are required to observe this at all, which is worth
knowing for any future test:
the run must be deployed rather than `trigger dev` (dev runs execute in
process and finish while
still holding blocker rows), and the wait after the caught error must
exceed the checkpoint
threshold, or it is served in process and never suspends.
### Why completing the batch waitpoint is sufficient
`batchTriggerAndWait` runs create, then stream, then wait. A phase 2
failure throws before the wait
is ever reached, and the reaper only fires on an unsealed batch, so the
parent is never suspended
awaiting the batch when it runs. The parent therefore does not need a
synthetic result, only to stop
being blocked. Note this reasoning depends on that ordering: if the wait
were ever reached with an
unsealed batch, completing the batch waitpoint alone would not settle
the caller.
## Follow-ups
- Batches stranded before this ships still need a one-off recovery; the
reaper only schedules at creation time.
- That same property leaves a gap if the process dies between creating
the batch and scheduling the job. A periodic sweep would close it, but
wants a supporting index.
- When a partially streamed batch aborts, children already enqueued keep
running while the parent fails. Left as-is deliberately, since
cancelling triggered work is a bigger semantic call.
<!-- ccr-slack-attribution -->
_Requested by **Eric Allam** · [Slack
thread](https://triggerdotdev.slack.com/archives/C0BEM9Z73TM/p1785491472104199)_
## Checklist
- [ ] I have followed every step in the [contributing
guide](https://github.com/triggerdotdev/trigger.dev/blob/main/CONTRIBUTING.md)
- [x] The PR title follows the convention.
- [ ] I ran and tested the code works
---
## Testing
Static checks only, all clean:
- `pnpm run typecheck --filter trigger.dev`
- `pnpm run format`
- `pnpm run lint`
No live task was triggered against a running project, so the "ran and
tested" box above is left unchecked.
---
## Changelog
**Before:** triggering a task through the MCP server always ran it in
the project's default region. There was no way to pick one.
**After:** the `trigger_task` tool accepts an optional `region` option,
so you can choose the region a run executes in.
**How:** `region: z.string().optional()` was added to
`TriggerTaskInput.options` in `packages/cli-v3/src/mcp/schemas.ts`. No
call-site change was needed — `tools/tasks.ts` passes `options` through
verbatim, and `TriggerTaskRequestBody.options.region` already existed.
The tool description in `docs/mcp-tools.mdx` gained a matching line, and
a patch changeset is included.
There is no batch-trigger MCP tool, so there is no sibling tool to
mirror this change on.
---
## Screenshots
N/A — no UI changes.
Co-authored-by: Claude <noreply@anthropic.com>
`test/envParamRoute.ownership.test.ts` fails on main: 3 of its 4 tests
throw
```
Error: [vitest] No "hasAdminDisplayAccess" export is defined on the
"~/services/session.server" mock. Did you forget to return it from "vi.mock"?
```
#4421 added a `hasAdminDisplayAccess(user)` call to the `env.$envParam`
loader, and the test's `vi.mock` of `session.server` only returns
`requireUser`, so the call blows up. Both changes were green in their
own PR and only conflict once merged together, which is why nobody
caught it.
The mock now mirrors the real implementation rather than returning a
constant, so it stays correct if the test's user fixture is ever varied.
No assertions were changed: the tests were right, the mock was stale.
Worth flagging separately: no workflow runs on push to main, so this has
been red since #4421 landed without showing up anywhere. Every PR opened
since has inherited the failure.
## Summary
Keeps the queue metrics ClickHouse tests stable as wall-clock time
advances.
## Root cause
The fixtures used fixed timestamps. Once those timestamps crossed the
tables' 30-day retention boundary, ClickHouse immediately expired the
inserted aggregate rows and all six tests read empty results.
The fixtures now derive a recent minute-aligned timestamp once per test
file. The second 10-second bucket and ranking window are derived from
the same anchor, preserving deterministic bucket relationships while
keeping rows inside both the raw and aggregate table TTLs.
Verified with `pnpm --filter @internal/clickhouse exec vitest run
src/queueMetrics.test.ts`.
Members added by SSO just-in-time provisioning or Directory Sync never
got
their per-member DEVELOPMENT environments - only invite acceptance and
project creation created them. `trigger dev` returned "Environment not
found" for those members and the dashboard had no dev view.
ensureOrgMember now queues provisioning for every membership it settles,
so
both paths are covered and members missing environments are repaired on
their next sync. Provisioning runs as a common-worker job to keep
sign-in
and directory webhooks off the per-project write loop. A failed enqueue
surfaces for Directory Sync, whose worker retries the idempotent effect,
and is swallowed for sign-in, where the next login enqueues again.
Environment creation now tolerates a concurrent creator so the
project-creation loop and the job cannot collide on the unique index.
Also fixes environment resolution ignoring dev-environment ownership: a
member without their own dev environment could be handed a colleague's
and
have it persisted as their dashboard preference.
## What
Two changes, shipped together:
1. **SDK migration (TRI-12460).** `@team-plain/typescript-sdk` is
deprecated. Move the webapp to its successors — `@team-plain/graphql`
(client) and `@team-plain/ui-components` (`uiComponent` builder).
Behaviour-preserving: the `PlainClient` customer upsert + thread
creation move to the new `client.mutation.*({ input })` shape; the
client now throws on failure, so `sendToPlain` wraps its calls and logs,
staying best-effort.
2. **Org tenant attribution (TRI-12461).** When org context is
available, `sendToPlain` now upserts a Plain tenant keyed by `externalId
= org_id`, links the customer to it, and stamps the created thread with
that tenant — so support threads become attributable to a Trigger.dev
org. Wired into the four add-on quota requests and the plan-cancellation
feedback (which already have org context). The tenant steps are isolated
in their own try/catch and the thread's `tenantIdentifier` is gated on
their success, so a tenant failure never blocks thread creation.
## Not affected
- `customer.externalId` stays `User.id` — the customer cards +
impersonation link are unchanged.
- No ticket content leaves Plain.
- Callers without a single org (e.g. the feedback widget) are unchanged
— the org params are optional.
## Deploy prerequisite
The webapp's Plain API key needs three **new** scopes for attribution to
work (it already has `customer:create`, `customer:edit`,
`thread:create`):
- [x] `tenant:create`
- [x] `tenant:edit`
- [x] `customerTenantMembership:create`
Until granted, nothing breaks — `sendToPlain` logs the forbidden error
and creates the thread without attribution.
## Testing
- `pnpm typecheck --filter webapp` passes; oxfmt + oxlint clean.
- Ran the real `sendToPlain` end-to-end via a throwaway vitest harness
against live Plain — confirmed the code path executes; the live write is
gated only by the key scopes above.
## Summary
A query sent to the query API with a typo in it, like a column name that
does not exist, was being reported as a server error. That put customer
SQL mistakes into our error alerting, where they made up almost all of
the volume on one of our noisiest alerts, and it drowned out the
failures that are actually ours to fix. This makes the level match who
is at fault, and fixes two related problems found alongside it.
## Invalid queries are the caller's, not ours
The query API route already got this right. It checks for `QueryError`,
logs at warn, and returns a 400, with a comment saying the system
handles it gracefully and no alert is needed.
The layer underneath ignored that. `executeTSQL` logged every exception
out of its catch block at error, including the compile failures the
route was about to turn into a 400, and error-level logs are forwarded
to error reporting.
The TSQL package already draws the line we need:
```ts
export class ExposedTSQLError extends BaseTSQLError {
/** An exception that can be exposed to the user. */
}
export class InternalTSQLError extends BaseTSQLError {
/** An internal exception in the TSQL engine. */
}
```
`SyntaxError` and `QueryError` extend the first. So the catch block now
branches on `ExposedTSQLError` and logs those at warn, keeping error for
`InternalTSQLError` and anything unanticipated, which is a genuine
compiler bug.
## SQL the caller wrote is their mistake, not ours
The same asymmetry showed up one level down. A query that compiles fine
can still be rejected by ClickHouse at execution, and most of those
rejections mean the caller's SQL is wrong rather than that we generated
something bad.
This is where the volume actually is. Checking production, one error
group alone, a missing `GROUP BY` on the public query API
(`NOT_AN_AGGREGATE`), accounts for over a million events across hundreds
of users. It is by far the largest error group in the project, and
classifying only by resource limit would have left every one of those at
error level.
So rejections are split three ways in `ClickhouseClient`, which is the
only place holding the parsed `ClickHouseError` and its symbolic type.
By the time the error reaches `executeTSQL` it has been wrapped and the
type is gone, and the type never appears in the message text, so it
cannot be recovered by string matching.
- **Resource limits** (memory ceiling, timeout, row/byte caps) log at
warn. The query is valid, it just asked for more than it is allowed to
spend.
- **Invalid SQL** (`NOT_AN_AGGREGATE`, `UNKNOWN_IDENTIFIER`,
`SYNTAX_ERROR`, the type and parse families) logs at warn **only when
the caller wrote the SQL**.
- **Everything else** keeps alerting.
That gate matters. The client is shared, so the identical rejection on
TRQL *we* generated is our bug and has to stay at error. Callers opt in
with `userAuthoredQuery`:
| caller | who wrote the SQL | opts in |
| --- | --- | --- |
| public query API | the customer | yes |
| query editor | the customer | yes |
| agent charts | the agent's model | yes |
| built-in dashboard tiles | us, in code | no |
| queue metric cards | us, in code | no |
| health report | us, in code | no |
The agent is the one judgement call. Its TRQL is not typed by a person,
but it is also not something a code fix makes correct, so a query it
gets wrong is not worth waking anyone for. The same endpoint serves
built-in tiles whose TRQL we do write, so the opt-in lives with the
caller rather than the route.
Separately, when one of these queries did fail, the log recorded the
generated ClickHouse SQL but not the query the caller actually wrote,
which made the reports hard to act on. `queryWithStats` takes an
optional `logFields` that `executeTSQL` uses to attach the original
TSQL.
## Events were attributed to the wrong request
Chasing the above turned up something broader: only a tenth of the
events on that alert pointed at the query API. The rest were pinned to
unrelated requests that happened to be in flight at the same time, so
the alert looked like the trigger endpoint was failing.
`Sentry.init` runs with `skipOpenTelemetrySetup: true`, because we
register our own OTel pipeline. That skips `initOpenTelemetry`, and one
of the things it does is:
```js
api.context.setGlobalContextManager(new SentryContextManager());
```
The async-context strategy is still installed, but `withIsolationScope`
only marks the OTel context and delegates the actual fork to that
context manager:
```js
// "We depend on the otelContextManager to handle the context/hub"
return api.context.with(ctx.setValue(SENTRY_FORK_ISOLATION_SCOPE_CONTEXT_KEY, true), ...)
```
`provider.register()` installed a plain
`AsyncLocalStorageContextManager`, which does not know that key. The
lookup found no scopes on the context and fell back to the
process-global default isolation scope, so every request wrote its
request data into the same object and the last writer won.
The tracer now registers `SentryContextManager`, which subclasses
`AsyncLocalStorageContextManager`, so OTel behaviour is unchanged. It is
also registered on the path where tracing is disabled, which previously
never called `register()` at all and so had no context manager of its
own.
Tenant tags were always correct, because those come from our own async
local storage rather than the isolation scope. That is why the
attribution being wrong was not obvious.
This affects every error report the webapp sends, not just the query
API.
## Verification
`internal-packages/clickhouse`: 76 tests pass, including eight covering
each level decision against a real ClickHouse container. Three pairs pin
the gate open and shut at both layers: an invalid query, a compile
failure, and a real limit breach driven with `max_rows_to_read` each log
at warn with `userAuthoredQuery` and at error without it.
The isolation fix has a test that reproduces the leak before asserting
the fix. Two overlapping requests each tag their own isolation scope;
with the plain context manager the slower one reads back the other's
tag, and with `SentryContextManager` each reads back its own.
Measured separately against a faithful reproduction of the server's
wiring (own OTel pipeline, CommonJS entry) at 200 concurrent requests:
per-request attribution goes from 0.5% to 100%, while span nesting,
context propagation across awaits, and distinct trace IDs are identical
before and after.
Adds the storage model and authorization contracts needed for multiple
environment API keys. Credentials are represented by hashed values,
revocation and expiration state, and persisted effective scopes.
The built-in authorization fallback exposes full-access policy
preparation, while optional authorization extensions can supply
additional presets and task-aware scope generation. This change does not
create, display, or authenticate additional keys.
## Summary
Three related changes, each independently gated:
**Queue metrics and health.** Per-queue depth, throughput (enqueued,
started, completed), concurrency, whether a queue is throttled, and
scheduling delay (how long a run waits between becoming eligible and
actually starting), plus a per concurrency-key breakdown for keyed
queues. Collected from inside the run queue itself, stored in
ClickHouse, and surfaced on the Queues list, a new per-queue detail
page, the task pages, and the run inspector. The question it answers is
"does this queue have enough concurrency to keep up, and if not, which
key or which limit is the constraint".
**Percent-based queue concurrency limits.** A queue's concurrency
override can now be expressed as a percentage of the environment limit,
stored as the source of truth and re-materialized whenever the
environment limit changes. Absolute overrides above the environment
limit are now **rejected with a 400** instead of being silently capped,
which is a behavior change on `POST
/api/v1/queues/:queue/concurrency/override`.
**The `health` report.** A server-computed verdict on whether work is
flowing, whether the runs that do start are healthy, and whether
telemetry is fresh, rendered as text with sparklines. Available as `GET
/api/v1/reports/:key`, `trigger report`, and the `get_report` MCP tool
(plus a `report` MCP prompt, which shows up as a slash command in hosts
that support prompts).
With the flags off, the Queues page renders the pre-metrics component
verbatim, nothing is emitted, and nothing is written to ClickHouse.
## Configuration
Two independent gates, on purpose. Emission is global so data accrues
for everyone before anyone can look at it; the view is per organization
so it can be turned on for one org at a time without a deploy.
**Runtime flags (no restart)**
| Flag | Store | Gates |
| --- | --- | --- |
| `queue_metrics:enabled` | run-queue Redis key (`"1"`/`"0"`, off by
default) | All emission, gauges and counters. Cached in-process for 10s
with stale-while-revalidate, warmed eagerly at boot so the first op
after a deploy is not dropped. |
| `queue_metrics:gauge_sample_rate` | run-queue Redis key, `0..1` |
Fraction of queue ops that emit a gauge. Counters are never sampled, so
throughput stays exact at any rate. |
| `queueMetricsUiEnabled` | feature-flag catalog: global `FeatureFlag`
row, per-org `Organization.featureFlags` override wins | Whether an org
sees the metrics view at all: the Queues list variant, the queue detail
route, the built-in Queues dashboard, the concurrency-keys endpoint, and
the metrics blocks on task pages and the run inspector. Off by default;
a gated org gets a 404 on the detail route rather than an empty page. |
Both Redis keys are readable and writable from `/admin/queue-metrics`
(super-admin UI, with a live per-shard stream-health table) and
`GET`/`POST /admin/api/v1/queue-metrics` (admin PAT). The admin surface
uses its own Redis client, so it works on any instance regardless of
whether that instance runs the emitter or the consumer.
**Environment variables (boot time)**
| Variable | Default | Notes |
| --- | --- | --- |
| `QUEUE_METRICS_EMIT_ENABLED` | `0` | Constructs the emitter and
injects it into the run engine. Without it the run queue has no emitter
at all. |
| `QUEUE_METRICS_CONSUMER_ENABLED` | `0` | Boots the stream consumer on
this instance. Independent of emission, so consumers can be sized
separately from the API. |
| `QUEUE_METRICS_STREAM_SHARD_COUNT` | `4` | Stream shards, hashed per
queue. |
| `QUEUE_METRICS_CONSUMER_BATCH_SIZE` | `1000` | Poll batch equals
insert batch, so an ack can never outrun a write. |
| `QUEUE_METRICS_REDIS_{HOST,PORT,USERNAME,PASSWORD,TLS_DISABLED}` |
falls back to the run-queue Redis | Set `HOST` to move the metrics
stream onto a dedicated instance so a metrics backlog cannot compete
with the run queue for memory. Self-hosters can leave it unset and get a
single-Redis deployment. |
| `QUEUE_METRICS_COUNTER_STREAM_MAXLEN` | `2000000` shared, `8000000`
dedicated | Bound on how much a stalled consumer can hold. The default
is deliberately lower when the stream shares the queue-critical Redis. |
| `QUEUE_METRICS_COUNTER_ODOMETER_TTL_SECONDS` | `604800` | TTL on the
per-queue cumulative counter key, refreshed on every write, so only
queues idle for the whole window are purged. |
| `QUEUE_METRICS_MAX_QUEUE_NAMES_PER_ENV` | `1000` | Distinct queue
names tracked per environment; overflow collapses into `__overflow__`. |
| `QUEUE_METRICS_MAX_CONCURRENCY_KEYS_PER_QUEUE` | `10000` | Same idea
one level down, per queue. |
| `QUEUE_METRICS_GAUGE_SAMPLE_RATE` | `1` | Default for the live
sample-rate key above. |
| `QUEUE_METRICS_QUERY_TABLES_VISIBLE` | `0` | Lists the queue-metrics
tables in the Query page, its schema docs, the schema API and the AI
query context. Off keeps them unlisted while the feature is dark; a
query naming them still runs either way. |
| `QUEUE_METRICS_CLICKHOUSE_URL` | falls back to the shared wiring |
Runs queue metrics on their own ClickHouse service: the consumer's
inserts and every queue-metrics read go through it, so a metrics-heavy
chart refresh never competes with runs-list or trace reads. Unset
reproduces the previous split exactly (inserts on `CLICKHOUSE_URL`,
reads on the query pool). |
| `QUEUE_METRICS_CLICKHOUSE_READER_URL` | the write URL | Reader split,
so the consumer's inserts can never land on a read endpoint. |
|
`QUEUE_METRICS_CLICKHOUSE_{KEEP_ALIVE_ENABLED,KEEP_ALIVE_IDLE_SOCKET_TTL_MS,MAX_OPEN_CONNECTIONS,LOG_LEVEL,COMPRESSION_REQUEST}`
| `1`, unset, `10`, `info`, `1` | Pool tuning, matching the other
per-workload ClickHouse clients. |
Migrations to apply: ClickHouse `036_create_queue_metrics_v1.sql`, and a
Postgres migration adding the nullable
`TaskQueue.concurrencyLimitOverridePercent`. Both are additive.
## How collection works
Queue operations produce two kinds of signal, and they have opposite
failure modes, so they are handled differently.
**Gauges** (queued, running, queue limit, env queued, env running, env
limit, throttled, plus keys-with-backlog and worst-key wait on keyed
queues) are read *inside* the same Redis script that performs the
enqueue or dequeue, so the reading is atomic with the operation it
describes rather than a racy follow-up read. The script returns them on
its reply and the app forwards them to the stream. Gauges are sampled
and drop-tolerant: they are aggregated with `max`, so a lost reading
costs resolution, never correctness.
**Counters** (enqueued, started, completed, plus nack and dead-lettered)
are cumulative odometers. Each event increments a per-queue key on the
metrics Redis and emits the absolute total, and ClickHouse takes the
difference across buckets at read time. This is the important property
of the design: a summed-delta counter undercounts permanently on any
lost event, while a cumulative one self-heals, because the next
surviving reading restates the whole total. Only bucket granularity can
be lost, never the total. A queue returning after its odometer TTL
expired restarts at 1 and reset detection handles it, which is safe
precisely because expiry only spans a window with no activity.
Both land on one sharded Redis stream. A consumer reads it with a
consumer group, reclaims stale pending entries on a 15s interval rather
than on every poll, maps one entry to one or two ClickHouse rows
(whole-queue and, for keyed queues, per-key), and acks only after the
insert lands. Each batch carries a dedup token derived from its
stream-entry ids, and the target tables set
`non_replicated_deduplication_window`, so a retried batch cannot
double-count either the raw rows or the aggregates that hang off them.
Consumer and emitter both emit OTel metrics
(`queue_metrics.emitter.emitted`,
`queue_metrics.consumer.{entries,rows_inserted,insert_errors,insert_duration,stream_depth,group_lag,pending,lag_unknown}`);
stream depth and group lag are the two worth alerting on, and
`lag_unknown` exists because Redis can report a null lag after a trim,
which must not be read as zero.
## Storage and read path
`queue_metrics_raw_v1` is a short landing table with a 6 hour TTL. Four
aggregate tiers are materialized straight from raw, never cascaded off
each other, each with a 30 day TTL:
- `queue_metrics_v1`, 10 second buckets per queue, the default read path
- `queue_metrics_5m_v1`, 5 minute buckets per queue, for wide ranges and
cross-queue ranking
- `env_metrics_v1`, 10 second buckets per environment, queue-independent
so it stays cheap at any range
- `queue_metrics_ck_v1`, 10 second buckets per concurrency key
Every tier is an MV from raw because the counter states do not survive a
cascade: their merge is order sensitive, so a `-MergeState` chain off
the 10s table inflates the result, and the same property means an
aggregate state may only be merged inside one queue. That constraint is
now enforced by the query engine rather than by reviewer discipline: a
column can declare a `mergeGroupKey`, and any query that references it
without grouping by, or pinning to a single value of, every named key
fails to compile with an actionable message.
On the read side, TRQL gains three tables (`queue_metrics`,
`env_metrics`, and a `queue_metrics_by_key` that is hidden from the
editor, schema docs and schema API but still queryable, so per-key rows
can never silently merge into a plain per-queue query), plus
`deltaSumTimestampMerge` and `quantilesTDigestMerge`. Two schema-level
optimizations ride along: a table can declare coarser rollups, so a
query whose bucket interval is 5 minutes or wider is routed to the 5m
table with no change to the query itself, and it can opt into the
ClickHouse query cache with time bounds floored to a fixed grid, so the
auto-refreshing dashboards actually share cache entries instead of
missing on every tick. Both are caller-side substitutions, so the
printer stays unaware of physical layout.
All of this can also live on its own ClickHouse service. A table
declares the pool its reads run on, the three queue-metrics tables name
the dedicated one, and the ingestion consumer writes through the same
client, so both directions move together with one env var and nothing
else routes differently.
The other engine change is opt-in gap filling: charts can request rows
for empty buckets, where counters zero-fill and gauges carry forward.
Grouped gauge series are densified per group and carried inside a
partition, so a quiet queue's line holds its last value without bleeding
another queue's value into it.
## Queue concurrency limits
`concurrencyLimitOverridePercent` on `TaskQueue` is the source of truth
when an override is set as a percentage; the absolute `concurrencyLimit`
is materialized from it (floored, clamped to at least 1 so a percentage
can never act as a pause, and never above the environment limit). Every
path that changes an environment limit now recalculates the
environment's percent-based overrides afterwards, outside the
transaction, and pushes changed limits to the engine. The push is
attempted even when the stored value did not change, so a previously
failed sync self-heals rather than leaving the database and the engine
diverged; paused queues are skipped so a recalculation cannot
effectively unpause one.
The API accepts exactly one of `concurrencyLimit` or `percent`, and the
reject-instead-of-clamp change above means a request asking for more
than the environment allows now fails loudly. The percent bound (greater
than 0, at most 100) is defined once and shared by the zod schema, the
dashboard mutation handler and the service, so the three cannot drift.
The concurrency-keys table on a queue is now paginated against the
ClickHouse per-key tier, ranked by peak backlog with the total on every
row from a single scan, and only the keys on the current page are
enriched with live counts from Redis. That replaces a hard top-50 cap
with something whose cost is a function of page size rather than key
cardinality.
## The health report
`GET /api/v1/reports/:key?period=&format=markdown|ansi|json`. The
verdict is computed on the server and is deterministic, not
model-generated. Three independent analyzers run over one input
snapshot: flow (is work moving, and if not, is the cause a limit,
throttling, one bad queue, or dead-lettering), execution (are the runs
that start succeeding, and at what latency), and liveness (how fresh is
the telemetry). When telemetry is genuinely stale, the first two are
forced to unknown and every actionable field is stripped, so no surface
ever advises action off stale data.
Authorization is per query table rather than a blanket query grant: a
JWT must be scoped to every table the report reads (`runs`,
`env_metrics`, `queue_metrics`), so a narrowly scoped token cannot pull
a report that reads more than it was granted. `period` is validated as a
shorthand with a 90 day ceiling at the edge. The report catalog is a
registry of `{ load, interpret }` entries, so the next report is a new
entry and no change to the route, the view model, the renderers, the CLI
or the MCP tool.
`trigger mcp` no longer launches the install wizard when stdout is a
TTY, which fixed a real failure: hosts spawn the server over a PTY, so
the wizard would open and the client would time out waiting for a server
that never started. The wizard now needs `trigger mcp --install`.
## The part that is live regardless of every flag
The enqueue and dequeue scripts now return a 2-tuple so a gauge reading
can ride back on the reply. Every return site in the eight affected
scripts is wrapped, and a `nil` original is converted to `false` on the
way out, because a raw `nil` in the first slot would make Lua truncate
the multi-bulk reply and silently drop the gauge on the throttled and
empty-queue paths. The reply shape and the destructuring on the app side
are exercised on every queue operation whether or not metrics are
enabled, so that is the part of `run-engine` worth the closest review.
One behavior fix in the same area: the scheduling-delay anchor is set
only on a run's first entry into the queue. Anchoring it to trigger time
on re-enqueues made waitpoint and checkpoint resumes report the entire
wait as scheduling delay. Queue ordering is untouched, so a re-enqueued
run keeps its position, and nacks deliberately keep the original anchor
because a rolled-back dequeue is the same continuous wait.
A pending-version promotion still anchors to trigger time, on purpose:
that promotion is the run's first real entry into the queue, since the
trigger deliberately held it back waiting for a worker version, and the
TTL is armed at the same point for the same reason. The consequence is
worth naming, because it is a judgement call: a run that waits on a
deployment reports that wait as scheduling delay on its queue, which is
time unrelated to queue capacity.
## Verification
Unit and integration suites across the new package, the run queue, the
mapping layer, the query engine and ClickHouse (including a test that
applies migration 036 through the same splitter CI uses, and a
regression test that inserts the same batch three times to prove the
aggregates do not inflate). Beyond that, the whole path was driven end
to end against a live stack with real runs: emitter to Redis stream to
consumer to ClickHouse to the dashboards, for both the local dev path
and the deployed path where a supervisor drives the dequeue, with
assertions on exact counter reconstruction per queue and per concurrency
key, throttling, environment saturation, scheduling delay, and a
deliberate mid-stream reading drop to confirm the cumulative counters
still reconstruct the correct total. The gated-off state was checked on
every touched surface.
The dedicated ClickHouse service was verified against a second,
separately-schema'd instance: with it configured, the driven counters
reconstruct exactly on the dedicated instance, the shared instance gains
no rows for that window, a read through the query API returns the value
that exists only on the dedicated instance, and a `runs` query still
succeeds (it would fail outright if it were mis-routed to a service
without that table). With the variable unset, the full suite passes
unchanged.
---------
Co-authored-by: Katia Bulatova <katia@trigger.dev>
Co-authored-by: Katia Bulatova <katherine.bulatova@gmail.com>
Co-authored-by: James Ritchie <james@trigger.dev>
<!-- ccr-slack-attribution -->
_Requested via [Slack
thread](https://triggerdotdev.slack.com/archives/C097ZHVKZFA/p1785249693523749)_
## Summary
Accepting an old invitation could change the role of someone who was
already in the organization. A long-pending invite can carry a lower
role than the member has since been promoted to, so accepting it was a
silent demotion. When the accepting user was the organization's only
Owner, the role layer refused that demotion, and the refusal (an
expected, protective outcome) was logged as an error.
An invitation now only sets a role on a membership the accept actually
created, and people who are already in an organization are skipped when
invitations are sent.
## How
`acceptInvite` already skipped the `OrgMember` create when it found an
existing membership, but the `rbac.setUserRole` call below it was gated
only on `invite.rbacRoleId`. It now also tracks whether this accept
created the membership. A create that loses the unique-constraint race
counts as pre-existing, since whichever flow won it owns that
membership's role.
Skipping existing members outright would regress one case: a member with
no RBAC role at all would never receive the invitation's role.
`ensureOrgMember` handles that with `healMissingRoleAssignment`, which
fills in a null role but never overwrites a real one, so
`assignInviteRbacRole` takes the same gate. An established role is never
touched; an absent one is filled in.
`assignInviteRbacRole` branches on the result's machine-readable `code`
instead of logging every refusal at `error`. `last_owner` goes to
`logger.info`, matching the two directory-sync role paths; everything
else, including a refusal that carries no code, goes to `logger.warn`.
The helper is best-effort and never throws, so no outcome it produces
warrants `error`. No string matching on the error text is involved.
`inviteMembers` resolves the organization's members by email and skips
those addresses before creating invites. The invite table's
`@@unique([organizationId, email])` only dedupes *pending invites*, so
it could never catch this.
## Invite surfaces
Skipping addresses means a batch can now come back empty, and neither
caller handled that:
- The dashboard action built its redirect from
`invites[0].organization`, so a batch where every address was skipped
threw a `TypeError` that reached the admin as a raw error string. It
also reported the submitted count rather than the created one. It now
names what it skipped ("No invitations sent: 1 already a member of this
organization") and counts what it actually created.
- The invites API derived `alreadyInvited` as "everything not created",
so an existing member was reported as though they had already been
invited. `inviteMembers` now returns the two groups separately and the
endpoint reports `alreadyMembers` alongside `alreadyInvited`.
## Testing
`apps/webapp/test/member.server.test.ts` passes 16/16 locally, up from
12.
Getting there needed a harness fix. The `~/db.server` mock did not
export `Prisma`, so any code reaching
`PrismaNamespace.PrismaClientKnownRequestError` threw before it could
branch, leaving every duplicate-key path in `member.server.ts`
unreachable from tests. The mock now re-exports the real `Prisma`, and
there is a case covering the pending-invite skip.
New cases: the invite role is applied when the accept creates the
membership; it is not applied when the member already has a role; it is
applied when an existing member has no role assigned; the organization
is still joined when the assignment is refused with `last_owner`; and
`inviteMembers` reports members separately from pending invites. Forcing
the gate off fails exactly the "already has a role" case, so the
coverage is load-bearing.
`pnpm run typecheck --filter webapp` and `oxfmt --check` both pass.
## Changelog
Accepting an old invitation could change the role of someone who was
already in the organization. An invitation now leaves an existing
member's role untouched, people who are already in an organization are
no longer sent invitations to it, and the invite form says which
addresses it skipped instead of failing with an unhelpful error.
---
## ✅ Checklist
- [x] I have followed every step in the [contributing
guide](https://github.com/triggerdotdev/trigger.dev/blob/main/CONTRIBUTING.md)
- [x] The PR title follows the convention.
- [x] I ran and tested the code works.
## Screenshots
No visual changes. The invite form's toast copy changes, as described
above.
---------
Co-authored-by: Claude <noreply@anthropic.com>
Co-authored-by: Matt Aitken <matt@mattaitken.com>
## Summary
Several docs pages rendered identical `<title>` tags, which weakens
search indexing and makes results ambiguous. Each affected page now has
a unique, descriptive title while keeping its existing sidebar label
unchanged.
Alongside the retitles:
- Removed two stale build-system upgrade pages that were no longer in
the navigation, with redirects to the current package upgrade guide.
- Redirected the build-extensions group index to its overview page so
the two URLs stop sharing a title.
- Dropped a leftover orphaned API reference page (its old URL already
redirects to the management overview).
No links break: nothing in the docs points at the removed pages, and
every redirect target exists.
Long organization, project, and environment names in the side menu were
cut off mid-character. They now fade out at the right edge like the rest
of the side menu items already did.
### Example of faded long names:
<img width="246" height="200" alt="CleanShot 2026-07-28 at 22 59 24"
src="https://github.com/user-attachments/assets/efa60b87-286f-4ab0-9d4e-490ef2de53e5"
/>
## Summary
The confirmation dialog for leaving a team or removing a teammate was
still built on the old `Alert` primitive: the entire question sat in the
title, there was no header divider or `Esc` affordance, and the footer
used small buttons pinned to the right.
It now uses the standard `Dialog` layout the rest of the dashboard uses.
The title is static ("Remove team member" / "Leave team"), the question
moves into the body with the person's name and the organization
highlighted, and the footer is a bordered row with medium Cancel and
confirm buttons. A member who has not set a name is now identified by
their email instead of "them".
Verified against a local dashboard on both dialogs. Confirming a removal
posts the member id, deletes the membership and shows the success toast.
Cancel, `Esc`, and Enter while Cancel is focused all close the dialog
without issuing a request, leaving the member in place.
No release note needed: this is a visual restyle of an existing dialog
with no behaviour change.
The wait docs describe the 5 second compute-billing threshold as if it
were also the suspension threshold. It isn't, and the gap is confusing
when you're sizing a poll interval:
- **Compute** stops being charged for any wait longer than 5 seconds.
- **Concurrency** is only released once the machine has been snapshotted
and shut down. For `wait.for` and `wait.until` that happens 60 seconds
into the wait — a shorter wait stays `EXECUTING` and holds its
concurrency slot for the whole wait, even though the compute is free.
So `await wait.for({ seconds: 30 })` in a polling loop never releases
its slot, which looks like a bug if the docs told you waits over 5
seconds checkpoint.
## Changes
**`docs/snippets/paused-execution-free.mdx`** — rendered on `/wait`,
`/wait-for` and `/wait-until`. Drops "we checkpoint and" from the
billing sentence so it's purely about compute, then adds one paragraph
for the concurrency half.
**`docs/queue-concurrency.mdx`** — the "Waits and concurrency" section
states flatly that waiting runs don't consume slots. Adds a short
subsection for the time-based exception.
**`docs/how-to-reduce-your-spend.mdx`** — "Waits longer than 5 seconds
automatically checkpoint your task, meaning you don't pay for compute" →
the compute claim only. Code comments follow, plus a pointer that
waiting doesn't always free concurrency.
**`docs/how-it-works.mdx`** — the Checkpoint-Resume walkthrough used
`wait.for({ seconds: 30 })` as *the* example of a wait that suspends.
Bumped to 5 minutes and noted the sub-60s exception.
No behaviour change — docs only.
Adds an opt-in way for operators to route deployed runs' API traffic
through a different origin than the public one, per organization. Set
`INTERNAL_API_ORIGIN` on the webapp and enable the
`internalApiOriginEnabled` feature flag (globally or per org, with the
org override winning in both directions): deployed runs for enabled orgs
then get `TRIGGER_API_URL` set to the internal origin instead of
`API_ORIGIN`. Useful for gradually moving run traffic onto a private
network path.
## Design
The origin is resolved when an attempt starts, so flag changes take
effect on the next attempt and roll back the same way, with no task
redeploys. The org override is read fresh per attempt; the global
default comes from the cached flags registry (a cold read fails safe to
the public origin). When `INTERNAL_API_ORIGIN` is unset the flag is a
no-op and no extra queries run, so existing deployments are unaffected.
Dev runs always use the public origin, and `TRIGGER_STREAM_URL` remains
unchanged.
<!-- ccr-slack-attribution -->
_Requested by **Eric Allam** · [Slack
thread](https://triggerdotdev.slack.com/archives/C0AU83M3136/p1785222101937829?thread_ts=1785207509.304669&cid=C0AU83M3136)_
Removes two dead Remix routes and the helpers only they used.
`app/routes/sync.traces.runs.$traceId.ts` (`/sync/traces/runs/:traceId`)
and `app/routes/sync.traces.$traceId.ts` (`/sync/traces/:traceId`) were
added with the original ElectricSQL run page and lost their only
consumers when the dashboard hooks that called them were deleted.
Nothing in the repo references either route today.
Also removed, because the deleted routes were their only callers:
- `OtelTraceIdSchema`, `RESERVED_ELECTRIC_SHAPE_PARAMS`, `TraceScope`,
`buildElectricTraceWhereClause` from `app/v3/electricShape.server.ts`
(the file stays — `UNSAFE_REALTIME_TAG_CHARS` /
`sanitizeRealtimeTagForSql` / `sanitizeRealtimeTagsForSql` are still
used by `realtime.v1.runs.ts` and `realtimeClient.server.ts`)
- the loader-specific cases in
`apps/webapp/test/spanTraceRoutes.replicaLag.test.ts` and
`internal-packages/run-store/src/runOpsStore.routesSpanTraceReadView.replicaLag.test.ts`
`app/utils/longPollingFetch.ts` is untouched —
`realtimeClient.server.ts` still uses it. `runOpsStore.ts` /
`PostgresRunStore.ts` are untouched too; the unrouted-lookup mechanism
there is generic and stays.
As a plain code fact: the run lookup these loaders performed keyed on
`TaskRun.traceId` alone, which is not an index-backed query shape. That
is noted only as context for why the code is not worth keeping around
unused.
### Judgement call worth a maintainer's opinion
The request was specifically about `/sync/traces/runs/:traceId`, the
route that looks up a run by `traceId`. This PR **also** deletes its
sibling `/sync/traces/:traceId`. The reasoning:
- both routes came in with the same ElectricSQL run-page work
- both lost their only consumers in the same later commit
- neither has any caller anywhere in the repo
- they share the same helper module, so keeping one means keeping the
helpers half-used
If you would rather keep the sibling, reverting just that one file
deletion is easy and does not affect the rest of this PR — say the word
and I will restore it along with the helpers it needs.
## ✅ Checklist
- [x] I have followed every step in the [contributing
guide](https://github.com/triggerdotdev/trigger.dev/blob/main/CONTRIBUTING.md)
- [x] The PR title follows the convention.
- [x] I ran and tested the code works
---
## Testing
Verification run locally from the repo root:
| Command | Result |
| --- | --- |
| `pnpm run format` | clean, no changes produced |
| `pnpm run lint:fix` | clean |
| `pnpm run lint` | pass (exit 0, no findings) |
| `pnpm run typecheck --filter webapp` | pass |
| `pnpm run typecheck --filter @internal/run-store` | pass |
A ripgrep sweep for `sync.traces`, `sync/traces`, `syncTraceRunsLoader`,
`buildElectricTraceWhereClause`, `OtelTraceIdSchema` and
`RESERVED_ELECTRIC_SHAPE_PARAMS` (excluding `node_modules`) returns zero
hits.
**Not fully verified:** both edited test files are testcontainers suites
and need a Docker runtime, which was not available in my environment. I
confirmed each file *collects* correctly with exactly the three intended
remaining tests and no import errors — notably, dropping the
`session.server` / `controlPlaneResolver.server` / `longPollingFetch` /
`env.server` mocks does not break module loading for the surviving
loaders. The assertions themselves then failed only on `Could not find a
working container runtime strategy`. CI should be the real signal here.
Per `apps/webapp/CLAUDE.md`, `pnpm run build --filter webapp` was
deliberately not run.
---
## Changelog
Removed two unused sync routes left over from the original ElectricSQL
run page, along with the helpers and tests that existed only to serve
them. No behaviour change — neither route had any caller.
---
## Screenshots
_n/a — no user-visible surface changes._
💯
---------
Co-authored-by: Claude <noreply@anthropic.com>
🚀 Publish Trigger.dev Docker / units (push) Failing after 1s
🚀 Publish Trigger.dev Docker / typecheck (push) Failing after 3s
🚀 Publish Trigger.dev Docker / publish-webapp (push) Has been skipped
🚀 Publish Trigger.dev Docker / publish-worker-v4 (push) Has been skipped
🚀 Publish Trigger.dev Docker / scan-webapp (push) Has been skipped
🚀 Publish Trigger.dev Docker / scan-supervisor (push) Has been skipped
🦋 Changesets PR / Create Release PR (push) Has been cancelled
🧭 Helm Chart Prerelease / lint-and-test (push) Has been cancelled
Workflow Checks / Actionlint (push) Has been cancelled
Workflow Checks / Zizmor (push) Has been cancelled
🚀 Publish Trigger.dev Docker / 📣 Dispatch main image (push) Has been cancelled
🧭 Helm Chart Prerelease / prerelease (push) Has been cancelled
## Summary
PRs opened by the claude GitHub app fail both the agent instructions
audit and the REVIEW.md drift audit before Claude gets a chance to run.
`claude-code-action` refuses any actor whose account type is not `User`
unless the actor is listed in `allowed_bots`:
```
Workflow initiated by non-human actor: claude (type: Bot).
Add bot to allowed_bots list or use '*' to allow all bots.
```
So those PRs land with two permanently red checks and no audit coverage
at all. Both workflows already allowlist Devin; this adds the claude app
alongside it.
## Why this does not open the workflows up to outside contributors
`allowed_bots` is only consulted for non-`User` actors. Humans,
contributor or maintainer, take the separate write-permission path and
are unaffected by what is in the list.
Beyond that, both jobs are guarded by
`github.event.pull_request.head.repo.full_name == github.repository`, so
a fork PR skips the job entirely, and they trigger on `pull_request`
rather than `pull_request_target`, so a fork-triggered run would get no
API key and a read-only token anyway.
The bot is named explicitly instead of using `"*"`, which would let
every bot trigger these audits, dependabot's PR stream included.
## Summary
The batches list page orders by `(createdAt DESC, id DESC)`, which is
why [#4361](https://github.com/triggerdotdev/trigger.dev/pull/4361)
added a matching index on `BatchTaskRun`. That index only landed in
`@trigger.dev/database`.
The dedicated run-ops database has its own migration history, so it
never received the index. `BatchListPresenter` reads both databases and
merges, so for environments whose batches live in the dedicated database
the page kept falling back to a scan and in-memory sort, which is the
exact behaviour #4361 set out to fix.
## Fix
Adds the index to the run-ops schema with its own migration. `CREATE
INDEX CONCURRENTLY IF NOT EXISTS`, so it is a no-op where the index
already exists and still records its ledger row.
The second half is the interesting part. Because the two packages own
separate migration histories, a run-graph schema change has to be
authored twice, and nothing made the miss visible: the run-ops status
check truthfully reports "up to date" against its own history, so the
apply step just skips.
`schemaParity.test.ts` compares the physical shape of every model the
run-ops schema declares against its counterpart in
`@trigger.dev/database`: scalar fields with their attributes, plus
`@@index`, `@@unique`, `@@id` and `@@map`. Relation navigation fields
are excluded, since the run-ops schema deliberately drops relations that
would cross a database boundary while keeping the scalar FK column. A
field counts as a relation when its type resolves to a model name, which
keeps enum-typed columns in scope.
Two models are listed as run-ops-only: `CompletedWaitpoint` and
`WaitpointRunConnection`, both explicit FK-free replacements for a
control-plane implicit many-to-many, since an implicit m2m carries a
foreign key that cannot resolve across databases. The test also asserts
that exception list is exhaustive, so a new unpaired model fails rather
than being silently skipped.
Confirmed the guard actually fails: reverting the index turns
`BatchTaskRun` red with the missing `@@index` named in the diff.
🚀 Publish Trigger.dev Docker / typecheck (push) Failing after 1s
🚀 Publish Trigger.dev Docker / units (push) Failing after 0s
🚀 Publish Trigger.dev Docker / publish-webapp (push) Has been skipped
🚀 Publish Trigger.dev Docker / publish-worker-v4 (push) Has been skipped
🚀 Publish Trigger.dev Docker / scan-webapp (push) Has been skipped
🚀 Publish Trigger.dev Docker / scan-supervisor (push) Has been skipped
🧭 Helm Chart Release / lint-and-test (push) Has been cancelled
🚀 Publish Trigger.dev Docker / 📣 Dispatch main image (push) Has been cancelled
🧭 Helm Chart Release / release (push) Has been cancelled
## Summary
2 new features, 9 improvements, 3 bug fixes.
## Highlights
- Allow additional environment API keys to create scoped public access
tokens through the Trigger.dev API. Use server-issued public access
tokens for batch operations so environment-scoped API keys can read
batch results.
([#4387](https://github.com/triggerdotdev/trigger.dev/pull/4387))
## Improvements
- Preserve the partial assistant message when a chat turn's model stream
fails mid-response. `chat.agent` now passes the recovered partial to
`onTurnComplete`, and `chat.createSession`'s `turn.complete()` keeps it
before rethrowing, instead of dropping the streamed-so-far output.
([#4348](https://github.com/triggerdotdev/trigger.dev/pull/4348))
## Server changes
These changes affect the self-hosted Docker image and Trigger.dev Cloud:
- Favorite any dashboard page to a new Favorites section in the side
menu, and customize the sidebar by renaming favorites, hiding items, and
reordering items and sections.
([#4375](https://github.com/triggerdotdev/trigger.dev/pull/4375))
- List API endpoints now clamp the page size to a maximum of 100.
Requests asking for a larger page size return up to 100 items and keep
paginating, rather than pulling an unbounded page.
([#4360](https://github.com/triggerdotdev/trigger.dev/pull/4360))
- Organizations without billing alerts now get default spend alert
thresholds, so you're notified before usage grows unexpectedly. The
billing limit page no longer pre-selects an option before you've set a
limit and prompts you to configure one. Alert previews now update
immediately after you change your billing limit.
([#4328](https://github.com/triggerdotdev/trigger.dev/pull/4328))
- When you create a Personal Access Token, the generated token now shows
its first and last few characters instead of being fully hidden, so you
can confirm you copied the right value.
([#4363](https://github.com/triggerdotdev/trigger.dev/pull/4363))
- Add metrics to the realtime backend that measure how often a single
changed run is served to multiple subscriptions in one batch.
([#4341](https://github.com/triggerdotdev/trigger.dev/pull/4341))
- Realtime run subscriptions can now be configured to read run data
straight from the primary database, so a run's latest state is never
served from a lagging replica. Off by default; replica reads are
unchanged unless you turn it on.
([#4378](https://github.com/triggerdotdev/trigger.dev/pull/4378))
- SSO and Directory Sync are no longer restricted to Enterprise plans —
get in touch and we can turn them on for your organization whatever plan
you're on.
([#4393](https://github.com/triggerdotdev/trigger.dev/pull/4393))
- Improved supervisor observability: it now reports metrics for its
outbound requests, making failed calls to upstream services easier to
monitor.
([#4350](https://github.com/triggerdotdev/trigger.dev/pull/4350))
- The runs list on a task's page now updates live — run statuses change
and newly triggered runs appear without a manual refresh, matching the
main Runs page.
([#4377](https://github.com/triggerdotdev/trigger.dev/pull/4377))
- Speed up the Batches list page for environments with a large number of
batches, which could previously time out while loading.
([#4361](https://github.com/triggerdotdev/trigger.dev/pull/4361))
- Container startup no longer prints database and ClickHouse connection
strings (with credentials) to the logs.
([#4346](https://github.com/triggerdotdev/trigger.dev/pull/4346))
- The tasks page no longer runs two queries whose results were never
displayed, cutting wasted work on every page load and removing a source
of hidden server errors
([#4380](https://github.com/triggerdotdev/trigger.dev/pull/4380))
<details>
<summary>Raw changeset output</summary>
# Releases
## @trigger.dev/build@4.5.8
### Patch Changes
- Updated dependencies:
- `@trigger.dev/core@4.5.8`
## trigger.dev@4.5.8
### Patch Changes
- Updated dependencies:
- `@trigger.dev/core@4.5.8`
- `@trigger.dev/build@4.5.8`
- `@trigger.dev/schema-to-json@4.5.8`
## @trigger.dev/core@4.5.8
### Patch Changes
- Allow additional environment API keys to create scoped public access
tokens through the Trigger.dev API. Use server-issued public access
tokens for batch operations so environment-scoped API keys can read
batch results.
([#4387](https://github.com/triggerdotdev/trigger.dev/pull/4387))
## @trigger.dev/python@4.5.8
### Patch Changes
- Updated dependencies:
- `@trigger.dev/sdk@4.5.8`
- `@trigger.dev/core@4.5.8`
- `@trigger.dev/build@4.5.8`
## @trigger.dev/react-hooks@4.5.8
### Patch Changes
- Updated dependencies:
- `@trigger.dev/core@4.5.8`
## @trigger.dev/redis-worker@4.5.8
### Patch Changes
- Updated dependencies:
- `@trigger.dev/core@4.5.8`
## @trigger.dev/rsc@4.5.8
### Patch Changes
- Updated dependencies:
- `@trigger.dev/core@4.5.8`
## @trigger.dev/schema-to-json@4.5.8
### Patch Changes
- Updated dependencies:
- `@trigger.dev/core@4.5.8`
## @trigger.dev/sdk@4.5.8
### Patch Changes
- Preserve the partial assistant message when a chat turn's model stream
fails mid-response. `chat.agent` now passes the recovered partial to
`onTurnComplete`, and `chat.createSession`'s `turn.complete()` keeps it
before rethrowing, instead of dropping the streamed-so-far output.
([#4348](https://github.com/triggerdotdev/trigger.dev/pull/4348))
- Allow additional environment API keys to create scoped public access
tokens through the Trigger.dev API. Use server-issued public access
tokens for batch operations so environment-scoped API keys can read
batch results.
([#4387](https://github.com/triggerdotdev/trigger.dev/pull/4387))
- Updated dependencies:
- `@trigger.dev/core@4.5.8`
</details>
Co-authored-by: github-actions[bot] <41898282+github-actions[bot]@users.noreply.github.com>
## Summary
The project Integrations page now uses the same settings layout as the
org SSO page: a centered column of titled rows with dividers, instead of
headings over bordered boxes. GitHub, Vercel and build settings read as
one consistent list, and the page titles itself "Integrations".
Confirmations persist rather than vanishing once you move past them
(`GitHub app: Installed`, `Vercel project: Connected`), plan-gated rows
offer an Upgrade button instead of a dead toggle, a disabled toggle
explains why in place and highlights the control that unlocks it, and
warnings are rows with a hazard icon and their recovery action on the
right. Copy throughout leads with the outcome instead of restating the
field label.
Two fixes along the way: a nested `<form>` in the Vercel panel that
failed hydration and silently truncated the page, and every settings row
carrying a few pixels more space above its title than below its
description.
### Before
<img width="1160" height="1972" alt="CleanShot 2026-07-26 at 21 56
42@2x"
src="https://github.com/user-attachments/assets/ed0fd676-36d8-4eb7-a16e-827a24f007d9"
/>
### After
<img width="1358" height="4455" alt="CleanShot 2026-07-26 at 19 14
28@2x"
src="https://github.com/user-attachments/assets/6a635e6a-c0eb-4a4c-a68f-fcde4d25e8a6"
/>
## Summary
Favorite any dashboard page and it appears in a new "Favorites" section
at the top of the side menu. The star next to the page title (or
Option+F) saves the exact view, filters and tabs included, with a name
derived from the URL ("Runs: Completed successfully, last 7d", "Run:
05hrqq9n") that you can rename inline from each item's hover menu.
The sidebar is customizable too: "Customize sidebar" (on section header
menus and in each "More" menu) opens a modal where you can reorder
sections, drag items into a new order, hide items behind a per-section
"More" popover, and rename or remove favorites. Changes apply on
Confirm, Reset restores the default layout without touching favorites,
and everything is stored per user in dashboard preferences.
## Screenshots
| Favorites in the side menu | Customize sidebar modal |
| --- | --- |
| 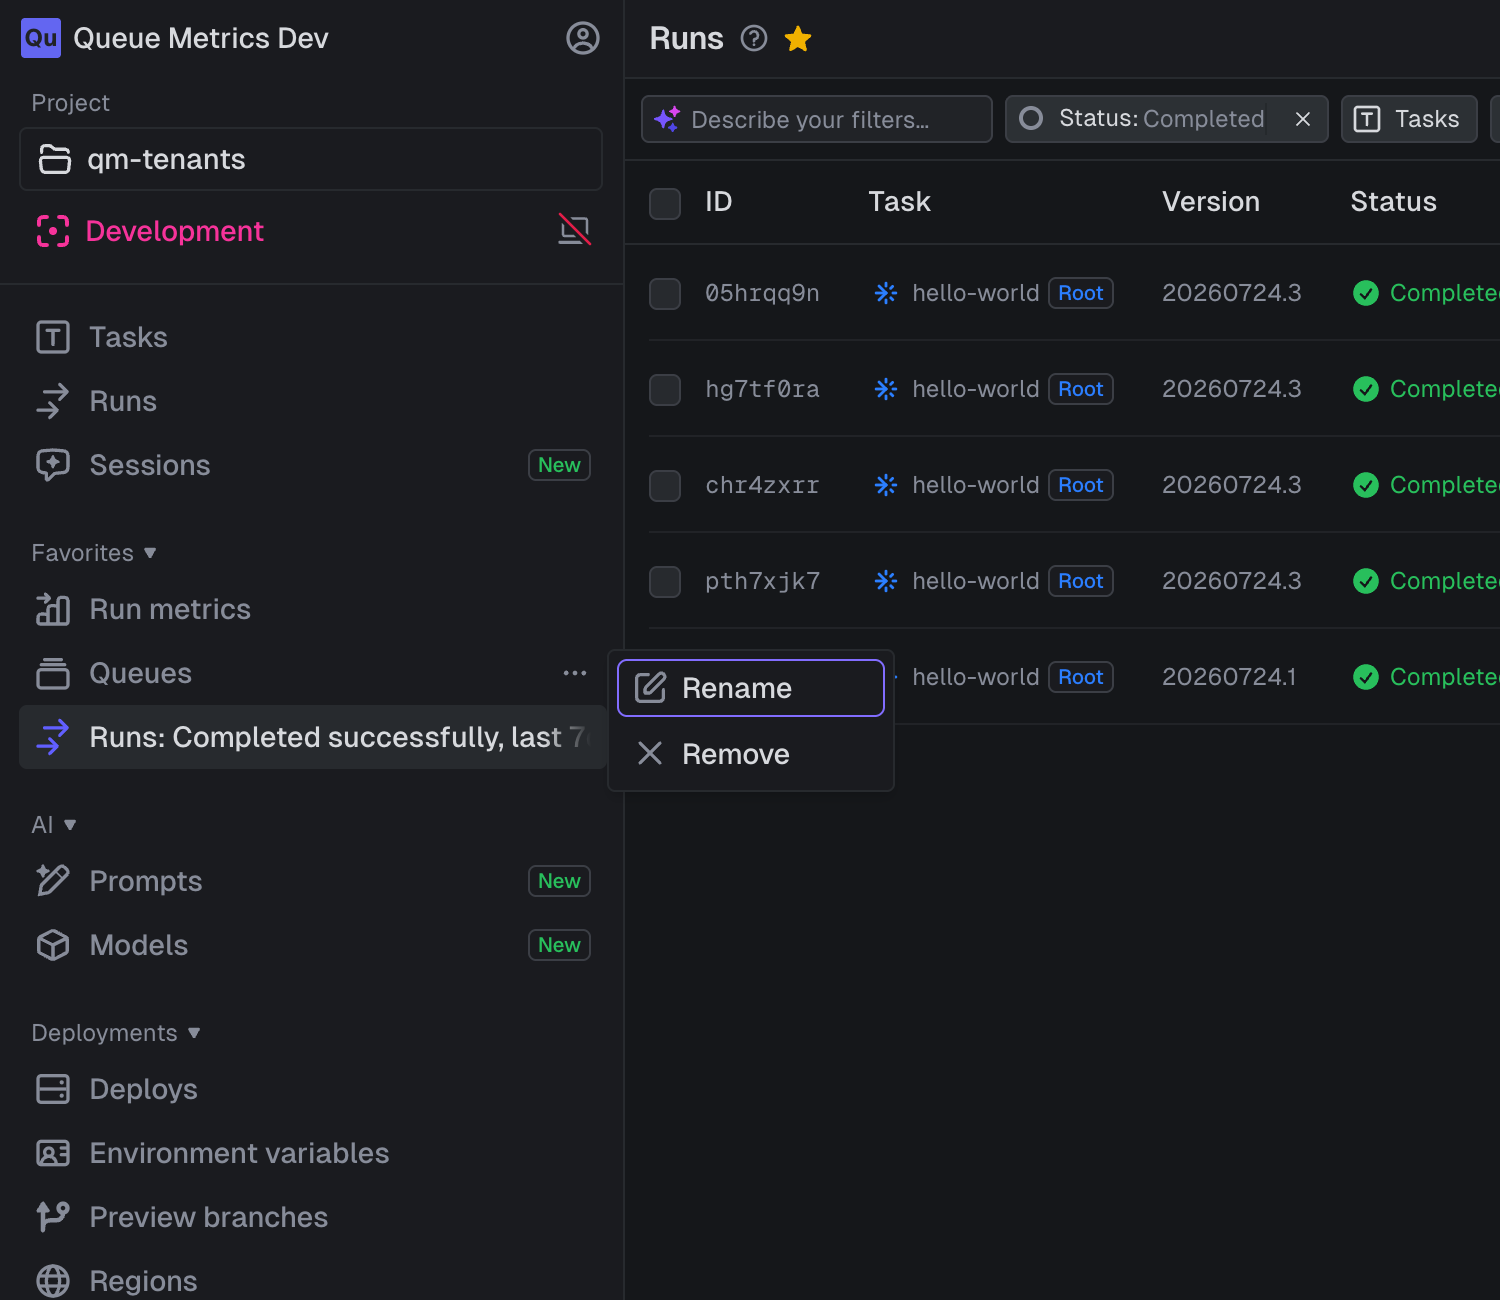
| 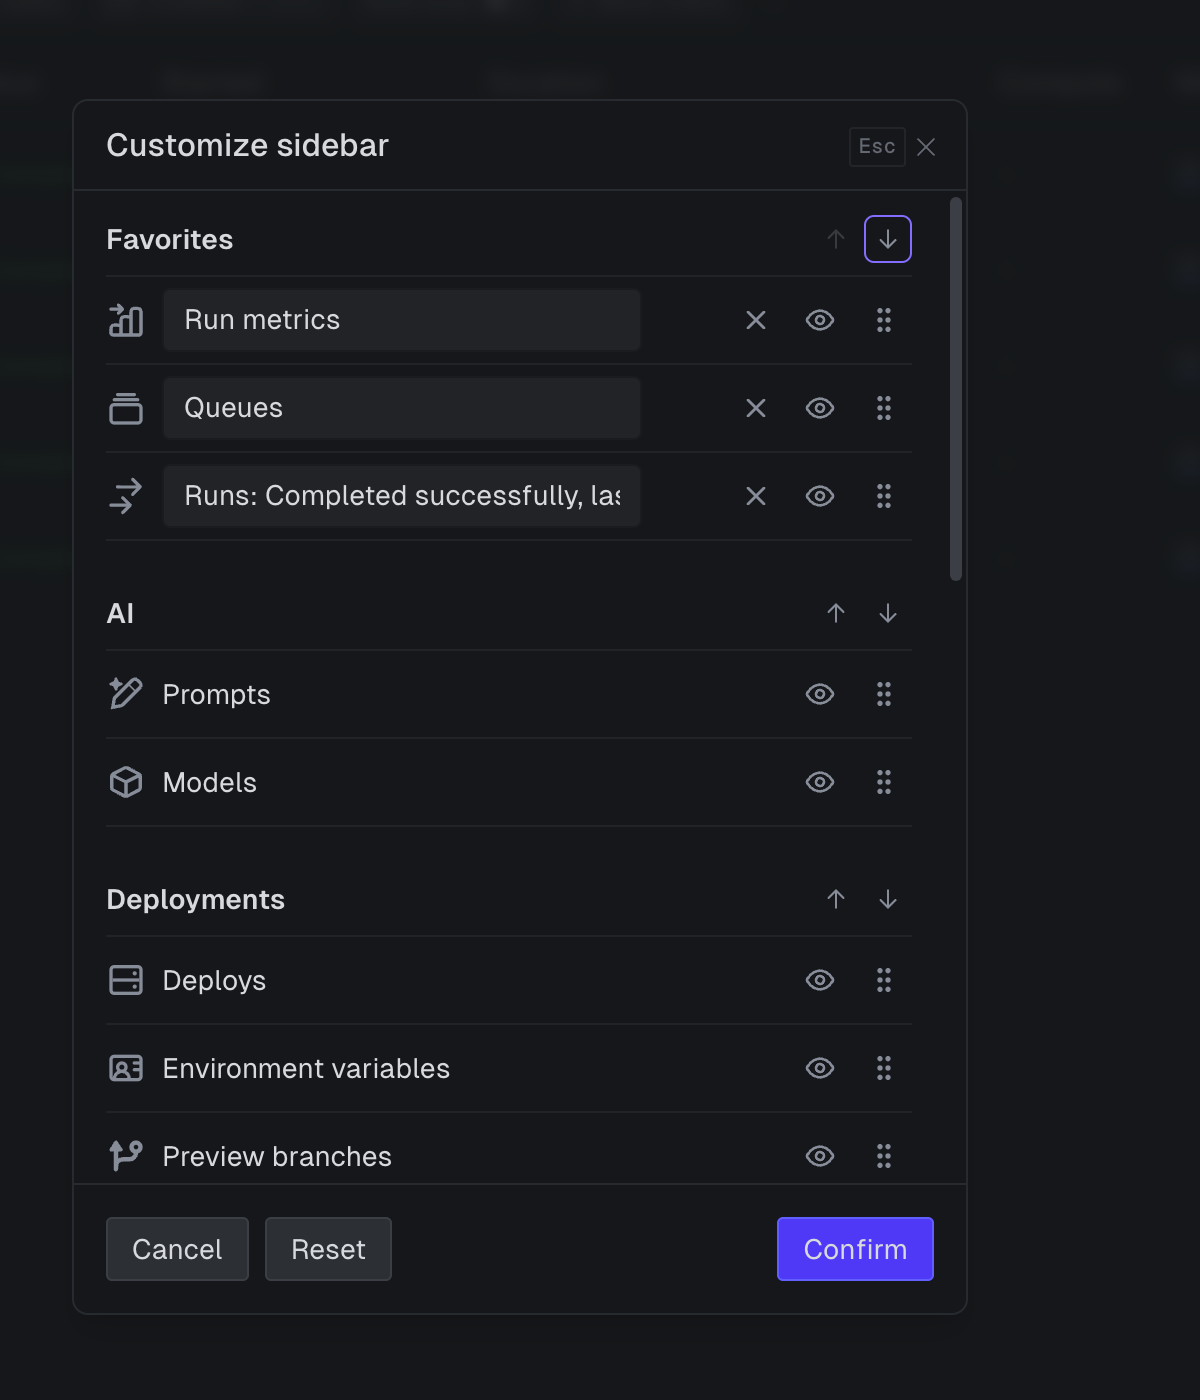
|
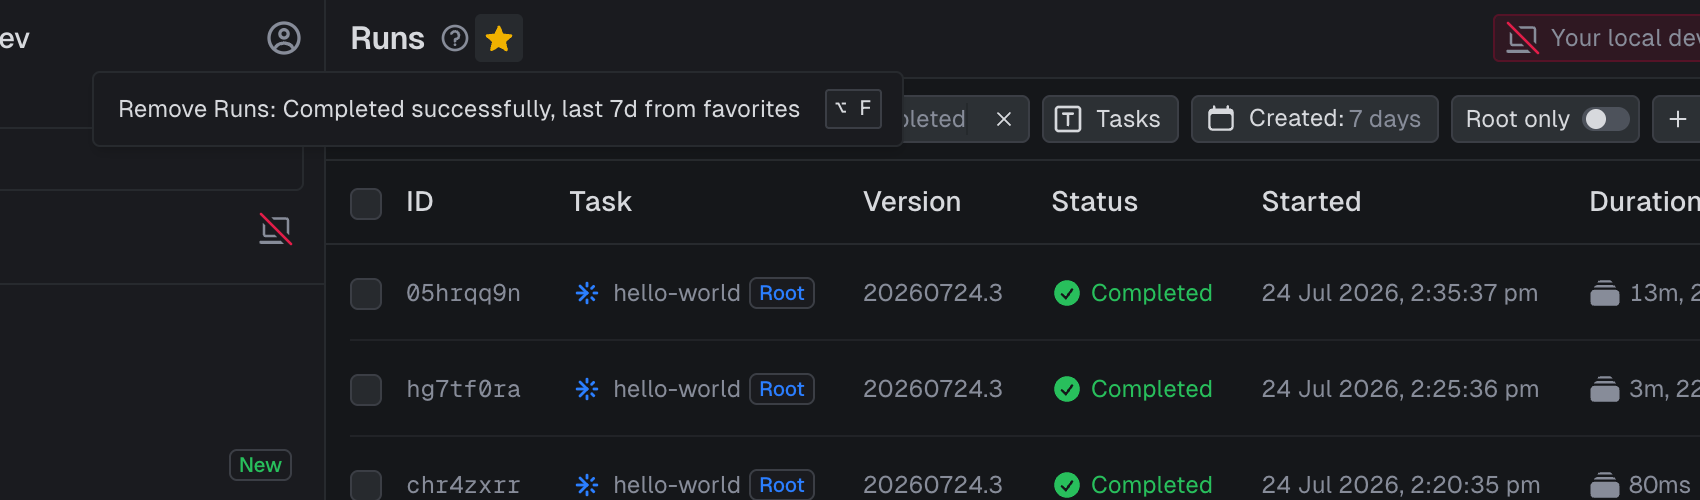
## Design notes
- Favorite links carry a small marker search param so the favorite, not
its identical main menu item, highlights as active. Markers from shared
or stale links are cleaned on load, and changing any filter hands the
highlight back to the regular menu item.
- Preference writes are serialized with a row lock: several writers
(debounced collapse and width saves, favorite toggles, the customize
modal) can land concurrently and would otherwise clobber each other's
read-modify-write of the JSON column.
- Option+F is matched on `event.code` with a raw listener because macOS
reports Option-modified letters as symbols, which the `event.key` based
shortcut hook can't capture.
Verified end-to-end in the browser: star toggle and shortcut, instant
section appearance, inline rename and staged modal removal, filter-aware
labels and unique active states, shared-link normalization, drag
reordering, and persistence across reloads.
## Summary
Additional environment API keys can use SDK APIs that require public
access tokens. The SDK detects the additional-key format and asks the
Trigger.dev server to mint scoped tokens instead of attempting to sign
them locally.
Root environment keys retain their existing local-signing behavior.
Trigger and batch clients also prefer server-issued tokens returned in
response headers while preserving compatibility with older servers.
## Deployment notes
This package update is safe to publish before servers expose additional
key creation. Existing root keys continue to use the current path, while
an additional key used with an older server fails with an actionable
upgrade error.
## Summary
The runs list on a task's page now updates live, matching the main Runs
page. Run rows update their status, duration, and cost in place as runs
progress, and a "N new runs" button appears in the header when newer
runs come in so you can pull them into the list without a manual
refresh. This applies to both standard and scheduled task pages.
## Design
It reuses the Runs page's polling hook. A task page scopes its runs by
the task in the URL path rather than a `tasks` query filter, so the hook
now takes an optional task slug and scopes new-run detection to it. The
"new runs" button sits in the header, outside the deferred runs table,
so the count is lifted to the page and the click action is passed
through a ref. That keeps the table streaming on first load instead of
blocking the header on the runs query.
When newer runs come in, a `1 new run` button appears in the task page
header, to the left of the time filter. Clicking it pulls the new runs
into the list.
Adds a gitignore rule for `**/docs/superpowers/` so locally-generated
planning and design scratch docs under that path aren't committed;
preventive only, no-op for existing tree.
The SSO & Directory Sync settings page decided access by comparing the
organization's plan code against the literal string `"enterprise"`. The
webapp now reads a `hasSso` entitlement from plan limits.
## Changes
- **`settings.sso` route** — `planAllowsSso` reads `limits.hasSso`
rather than the plan code; the loader and the action gate on a shared
`getSsoEntitlement` helper.
- **`platform.v3.server`** — new `getSsoEntitlement(orgId)` returning
`entitled | not_entitled | unknown`, behind a new SWR cache namespace
(60s fresh / 120s stale, memory + Redis). This replaces an uncached
billing round-trip that previously ran on every settings load, so the
page gets cheaper than it was.
- **`directorySyncEffects`** — the entitlement is now checked before
applying membership effects, per organization and memoised across a
batch.
- **`@trigger.dev/platform` 1.2.0 → 1.3.0** — required, see below.
## Behaviour worth reviewing
**Revocation now stops SCIM.** Previously the plan check existed only on
the settings page, so an org that lost access kept receiving
directory-sync pushes indefinitely; only the config UI froze. Provision
*and* deprovision are gated, so a revoked entitlement can't remove
members either.
**An unreadable entitlement throws instead of skipping.** Effects are
idempotent and the worker retries, so retrying is lossless where
dropping would silently lose a directory change. It's raised at `warn`
level so a transient billing blip doesn't page anyone.
**The login path is deliberately untouched.** A hard entitlement check
there turns a billing outage into a login outage. Consequence: an org
that loses the entitlement keeps its existing SSO logins working until
the connection is removed. Gating sign-in is a separate decision.
**Self-hosted is unaffected.** With no billing service configured the
helper returns `entitled`, leaving plugin presence and the kill switch
as the only gates — a self-hoster who installed the plugin isn't locked
out of it.
## The dependency bump is load-bearing
The `Limits` schema is a plain `z.object`, so it *strips* unknown keys.
On 1.2.0 the `hasSso` field was silently discarded during parsing and
read as `undefined` no matter what billing sent — a structural accessor
would not have helped. Verified against both builds:
```
1.2.0 → parsed: true | hasSso survives: false
1.3.0 → parsed: true | hasSso survives: true
```
This PR therefore cannot merge before 1.3.0 is published, which it now
is.
## Testing
`apps/webapp/test/directorySyncEffects.server.test.ts` — 7 tests over
the gate: applies when entitled, skips provision and deprovision when
not, throws a warn-level retryable error when unreadable, resolves once
per org across a batch, and gates per org so one unentitled org doesn't
block another.
`pnpm run typecheck --filter webapp` passes (18/18), oxfmt and oxlint
clean.
**Before:** `ip-address` resolved twice in `pnpm-lock.yaml` — `8.1.0`
under `@jsonhero/json-infer-types`, and `10.0.1` under
`express-rate-limit`.
**After:** a single `ip-address@10.2.0` entry, shared by both chains.
**How:** `express-rate-limit@8.2.1` pinned `ip-address` to an exact
version, so the parent itself had to move — `8.5.1` onwards declares a
range instead, and `@modelcontextprotocol/sdk` already allows `^8.2.1`,
so scoping that parent to `^8.6.0` lets `ip-address` resolve on its own.
`@jsonhero/json-infer-types` caps `ip-address` at `^8.1.0` and is
already at its latest published release, so that chain gets a scoped
override instead of a parent bump. `jsbn` and `sprintf-js` drop out of
the tree as a side effect.
Both overrides are parent-scoped, so the `cli-v3` chain is deliberately
untouched: it resolves `@modelcontextprotocol/sdk` 1.25.2, which
declares `express-rate-limit ^7.5.0` and pulls in no `ip-address` at
all.
`pnpm-lock.yaml` regenerated. `package.json` and `pnpm-lock.yaml` are
the only two files changed.
Nothing in the repo imports `ip-address` or `express-rate-limit`
directly. Both chains are transitive under `apps/webapp` —
`@jsonhero/schema-infer` (used by `TestTaskPresenter.server.ts`) and
`@vercel/sdk` — so no published `@trigger.dev/*` package is affected.
---
## Testing
- `pnpm install --lockfile-only` regenerates cleanly, and `pnpm install
--frozen-lockfile --lockfile-only` passes, so the lockfile matches the
manifests.
- Package churn is limited to the intended set: `express-rate-limit`
8.2.1 to 8.6.0, `ip-address` 8.1.0 and 10.0.1 collapsing to 10.2.0, and
`jsbn` / `sprintf-js` removed. No other resolution moved.
- `@jsonhero/json-infer-types` only calls `new Address4()` / `new
Address6()` inside a try/catch to classify strings. Ran that exact logic
against both `8.1.0` and `10.2.0` over 27 inputs (v4, v6, zone IDs,
CIDR, IPv4-mapped, malformed, empty, non-strings): identical results in
all 27. Both are still CJS named exports in `10.2.0`, with the same
`engines` floor.
- Drove the real `inferSchema()` path from `@jsonhero/schema-infer` with
`ip-address` forced to `10.2.0`; it still detects `ipv4` and `ipv6`
formats correctly.
- `express-rate-limit` 8.6.0 keeps the same `express` peer range (`>=
4.11`) and the same node floor as 8.2.1. Its new `debug` dependency
resolves to a version already present in the tree.
- `oxfmt --check` passes on the modified `package.json`.
- Both bumped versions clear the repo's `minimumReleaseAge` window; the
newest `express-rate-limit` (8.6.1) and `ip-address` (10.2.1+) releases
do not yet, which is why this lands on 8.6.0 and 10.2.0.
- Not run here: a full monorepo install, typecheck and test suite. No
TypeScript changed, and neither package leaks types into ours —
`ip-address` is not referenced in `json-infer-types`' or
`schema-infer`'s declaration files — so CI should be the judge of the
wider suite.
---
## Changelog
Routine dependency maintenance, no behaviour change. No changeset or
`.server-changes/` entry: the diff touches only the root `package.json`
and `pnpm-lock.yaml`, not `packages/*`, `integrations/*`, `apps/webapp/`
or `apps/supervisor/`.
Co-authored-by: Claude <noreply@anthropic.com>
Co-authored-by: nicktrn <55853254+nicktrn@users.noreply.github.com>
<!-- ccr-slack-attribution -->
_Requested via [Slack
thread](https://triggerdotdev.slack.com/archives/C097ZHVKZFA/p1785082528841609)_
`TaskListPresenter` created promises that nothing ever consumed. Two of
the three deferred metrics promises it returned had no reader, no
`await` and no `.catch()`, so when the query behind one of them failed
the rejection had nowhere to go.
## Before / After
**Before**
- `TaskListPresenter.call()` returned four things: `tasks`, `activity`,
`runningStats` and `durations`. Its only caller reads `tasks` and
`runningStats`.
- Every load of the tasks page therefore fired two ClickHouse queries
whose results were thrown away.
- If either of those two queries failed, the resulting promise rejection
was unhandled — nothing was awaiting it and nothing had attached an
error handler, so it surfaced as an unhandled rejection at the process
level rather than as an error anyone could attribute to a request.
**After**
- `TaskListPresenter.call()` returns `tasks` and `runningStats` only.
- Two fewer queries run per tasks-page load.
- There is no longer an unconsumed promise that can reject without a
handler. `runningStats` is awaited by its caller, so its failures
continue to be handled the way they always were.
Nothing changes on screen: the tasks page renders `hourlyActivity` and
`runningStates`, and neither of the removed values fed either of those.
## How
The removed values were verified unreferenced before deleting anything:
- `TaskListPresenter` has exactly one caller,
`UnifiedTaskListPresenter`, which reads `taskResult.tasks` and
`taskResult.runningStats` and nothing else.
- No file anywhere in the repo — app code, tests, or type re-exports —
reads an `activity` or `durations` field off the presenter's result.
- `UnifiedTaskListPresenter` builds its own
`unifiedTaskListHourlyActivity` query for the 24h chart the page
actually renders, which is what made the presenter's separate 7-day
daily activity data redundant.
- `getDailyTaskActivity` and `getAverageDurations` on
`ClickHouseEnvironmentMetricsRepository` had no callers other than the
two lines being deleted, so they and their now-orphaned helpers and
types were removed too.
Changes:
- `apps/webapp/app/presenters/v3/TaskListPresenter.server.ts` — drop the
`activity` and `durations` fields (both from the main return and from
the no-current-worker early return) and the two repository calls behind
them. Drop the unreferenced `TaskActivity` type alias. The "don't await
this" comment on the remaining `runningStats` promise now spells out
that the caller has to consume it.
- `apps/webapp/app/services/environmentMetricsRepository.server.ts` —
remove `getDailyTaskActivity` and `getAverageDurations` from the
`EnvironmentMetricsRepository` interface and its ClickHouse
implementation, along with `fillInDailyTaskActivity` and the
`DailyTaskActivity` / `AverageDurations` types.
`getCurrentRunningStats` is the control that shows the diagnosis is
right. It throws on query failure in exactly the same way as the two
removed methods — `if (queryError) throw queryError` — but it never
produced an unhandled rejection, because `UnifiedTaskListPresenter`
passes its promise into a `Promise.all(...).then(...)` chain that the
route then awaits. Same failure mode, opposite outcome, and the only
difference is whether anything consumes the promise.
Follow-ups, not in this PR:
- `AgentListPresenter` returns three sparkline promises in the same
shape and they look similarly unconsumed. Left alone here to keep this
change reviewable.
- With these two callers gone, the `getTaskActivity` and
`getAverageDurations` query builders in `@internal/clickhouse` have no
remaining callers in this repo. Whether to remove them is a separate
call for someone who owns that package.
## ✅ Checklist
- [x] I have followed every step in the [contributing
guide](https://github.com/triggerdotdev/trigger.dev/blob/main/CONTRIBUTING.md)
- [x] The PR title follows the convention.
- [x] I ran and tested the code works
---
## Testing
- `pnpm run typecheck --filter webapp` — passes. This is the meaningful
check here: it proves nothing still references the removed fields,
methods or types.
- `pnpm run format` and `pnpm run lint:fix` — clean, no changes
produced.
- No test file referenced the removed symbols, so no test needed
updating.
---
## Changelog
Server-only change, so this carries a `.server-changes/` note rather
than a changeset:
`.server-changes/task-list-remove-unused-metrics-queries.md`.
> The tasks page no longer runs two queries whose results were never
displayed, cutting wasted work on every page load and removing a source
of hidden server errors
---
## Screenshots
_No visual change — the removed data was never rendered._
Co-authored-by: Claude <noreply@anthropic.com>
## ✅ Checklist
- [x] I have followed every step in the [contributing
guide](https://github.com/triggerdotdev/trigger.dev/blob/main/CONTRIBUTING.md)
- [x] The PR title follows the convention.
- [ ] I ran and tested the code works — n/a, this PR only deletes two
workflow files
---
## Summary
**Before:** two scheduled workflows in this repo posted Dependabot
digests to Slack — a critical-alert check every morning at 08:00 UTC,
and a summary of all open alerts on Mondays at 08:00 UTC.
**After:** neither runs. This reporting is handled centrally now, so the
two in-repo workflows were duplicating it.
**How:** deletes `.github/workflows/dependabot-critical-alerts.yml` and
`.github/workflows/dependabot-weekly-summary.yml`. Both were
self-contained — inline shell, no shared scripts or composite actions —
so nothing else in `.github/` referenced them.
Dependabot itself is unchanged: `.github/dependabot.yml`, alerts, and
version updates all keep working. This removes only the two Slack
notifiers.
The `ENABLE_DEPENDABOT_ALERTS` repository variable existed only to
switch these two workflows off. Nothing else reads it, so it can be
removed from the repository settings if it's set.
---
## Testing
No runtime code changes — this PR only removes two scheduled workflow
files. Verified that nothing else in the repo references either
filename, either workflow name, or the `ENABLE_DEPENDABOT_ALERTS`
variable.
---
## Changelog
Removed the two in-repo scheduled workflows that posted Dependabot
digests to Slack.
Co-authored-by: Claude <noreply@anthropic.com>
🦋 Changesets PR / Create Release PR (push) Has been cancelled
🚀 Publish Trigger.dev Docker / 📣 Dispatch main image (push) Has been cancelled
🚀 Publish Trigger.dev Docker / typecheck (push) Failing after 2s
🚀 Publish Trigger.dev Docker / units (push) Failing after 2s
🚀 Publish Trigger.dev Docker / publish-webapp (push) Has been skipped
🚀 Publish Trigger.dev Docker / publish-worker-v4 (push) Has been skipped
🚀 Publish Trigger.dev Docker / scan-webapp (push) Has been skipped
🚀 Publish Trigger.dev Docker / scan-supervisor (push) Has been skipped
## Summary
The realtime runs feed hydrates run rows from read replicas, which means
it needs a replica-lag gate to avoid serving a run's previous state
right after a write. Setting
`REALTIME_BACKEND_NATIVE_RUN_READS_FROM_PRIMARY=1` reads those rows from
each run store's primary instead, so there is no lag to gate against: no
probe, no wake delay, no stale-read retries. Off by default, so nothing
changes unless you set it.
## Design
The run stores already decide replica-vs-primary from the *brand* on the
read client they are handed: a branded replica keeps the read on the
owning store's replica, an unbranded writer escalates it to that store's
own primary. So this is a one-line choice at the hydrator, and it stays
correct across topologies. With the run-ops split on, each leg lands on
its own writer and the caller's client is never forwarded across
databases; with the split off, it is the single database's primary.
```ts
const runReader = new RunHydrator({
readClient: runReadsFromPrimary ? prisma : $replica,
runStore,
});
```
The same flag skips constructing the lag estimator, since probing a
replica the feed no longer reads would be measuring the wrong thing.
Independently, `AuroraReplicaLagSource` detected Aurora by letting
`aurora_replica_status()` fail, on the assumption that the app-level
catch made that free. It isn't: an unresolvable function is a query
error the driver reports to the error log on every sample, so a
non-Aurora replica produced a continuous stream of error events while
the estimator quietly fell through to its next candidate. It now
resolves the function with `to_regproc` and memoizes the answer, so the
unparseable call never reaches the wire.
2026-07-26 19:43:41 +01:00
2215 changed files with 258963 additions and 32033 deletions
Preserve the partial assistant message when a chat turn's model stream fails mid-response. `chat.agent` now passes the recovered partial to `onTurnComplete`, and `chat.createSession`'s `turn.complete()` keeps it before rethrowing, instead of dropping the streamed-so-far output.
@@ -56,8 +56,8 @@ Every PR gets a performance pass — not just the ones that look perf-sensitive.
## Always check
- **Tests use testcontainers, not mocks.** Vitest with `redisTest` / `postgresTest` / `containerTest` from `@internal/testcontainers`. Any new `vi.mock(...)` on Redis, Postgres, BullMQ, or other infra is wrong here — 🔴 if added in production-path tests, 🟡 if isolated unit test.
- **Public-package changes have a changeset.** `pnpm run changeset:add` produces `.changeset/*.md`. Required for any edit under `packages/*`. Missing → 🟡; missing on a breaking change → 🔴.
- **Server-only changes have `.server-changes/*.md`.** Required for `apps/webapp/`, `apps/supervisor/` edits with no public-package change. Body should be 1-2 sentences (it has to fit as one bullet in a future changelog). Missing → 🟡.
- **User-facing public-package changes have a changeset.** `pnpm run changeset:add` produces `.changeset/*.md`. Changesets are user-facing release notes, not a catalog of every change: required when a `packages/*` or `integrations/*` change is something a user would notice or act on, skipped for internal-only changes, refactors, chores, and packages not consumed independently (e.g. `@trigger.dev/redis-worker`). Missing on a user-facing change → 🟡; missing on a breaking change → 🔴. Do not flag a missing note when the change is not user-facing.
- **User-facing server-only changes have `.server-changes/*.md`.** Required for user-facing `apps/webapp/`, `apps/supervisor/` edits in a PR with no package or integration change that requires a changeset; skip internal-only or admin-only changes, refactors, and chores. Body should be 1-2 sentences (it has to fit as one bullet in a future changelog). Missing on a user-facing change → 🟡.
- **Lua script naming.** Coexisting scripts use behavior-descriptive suffixes (`Tracked`), never `V2`. Old name must keep working until the next deploy clears it.
- **RunQueue payload shape.** V2 run-queue payload's `projectId` is consumed by `workerQueueResolver` for override matching. If a PR drops it from the payload, 🔴.
- **`safeSend` scope.** Defensive IPC wrappers belong on loop / interval / handler contexts, not one-shot terminal sends. If the PR adds `safeSend` to a single terminal call for consistency, 🟡 with a "remove this" suggestion.
description: Adversarially verifies one landed packet against its requirement; read-only.
model: opus
---
You are an adversarial code reviewer for one landed packet. READ-ONLY: never modify code, never commit, never push, never post to GitHub.
- Try to refute that the change answers its stated requirement; look for the failure scenario, not confirmation.
- Check the diff for unrelated drift, dead code, broken semantics of neighbors, and whether tests prove the actual invariant (would the test fail if the fix were subtly wrong?).
- Check the change landed in the correct PR/branch of the stack.
- Distinguish fact from inference; cite exact file:line evidence.
- Return: verdict (approve / needs-changes) with evidence per concern, and the exact minimal correction when needs-changes.
description: Implements exactly one work packet — minimal diff, targeted checks, own-paths-only commits.
model: opus
---
You are a code writer. Implement exactly the one work packet in your prompt.
- Minimal diff; match surrounding style and idiom.
- Prefer no comment at all; comment only a non-obvious constraint, max 2 short lines. All texts (comments, commit messages) short, clear, simple.
- Verify the packet's own diagnosis against the code before applying; if it is wrong, STOP without committing and report why.
- Run only the targeted checks for your packet: the relevant vitest files, `pnpm run typecheck --filter <pkg>` when the change warrants it. Never full suites unless asked.
-`pnpm run format` on touched files before committing.
- Stage and commit ONLY your packet's files. Conventional commit message. NO Claude attribution, no Co-Authored-By.
- Push only if the packet explicitly says to.
- Return: what changed, evidence (test output), commit SHA, and anything contradicting the diagnosis.
When modifying server apps (webapp, supervisor, etc.) with **no package changes**, add a `.server-changes/` file instead of a changeset:
`.server-changes/` files are user-facing release notes, not a catalog of every change. When a user-facing server app change (webapp, supervisor, etc.) is in a PR with **no package or integration change that requires a changeset**, add a `.server-changes/` file instead of a changeset. Skip it for internal-only or admin-only changes, refactors, and chores:
- If the PR also touches `packages/`, just the changeset is sufficient (no `.server-changes/` needed).
- If the PR also touches `packages/` or `integrations/` and that change needs a changeset, the changeset covers it (no `.server-changes/` needed). If the package or integration change is internal and needs no changeset, still add a `.server-changes/` file for the user-facing server change.
The body ships **verbatim in user-facing release notes**. Keep it to 1–2 short sentences, non-technical, written for a dashboard user: describe what changed for them, never the implementation (no header names, endpoints, middleware, storage mechanisms, internal tools). See `.server-changes/README.md` for full guidance.
@@ -4,11 +4,13 @@ This directory tracks changes to server-only components (webapp, supervisor, etc
## When to add a file
**Server-only PRs**: If your PR only changes `apps/webapp/`, `apps/supervisor/`, or other server components (and does NOT change anything in `packages/`), add a `.server-changes/` file.
These entries are **user-facing release notes**, not a catalog of every change. The test is "would a user or customer care about this change?", not "did I touch a server app?". Add one only when a server-only change is something a user would notice, act on, or want to hear about (a feature, a bug fix they could have hit, a behavior or performance change they would feel). Skip it for internal-only or admin-only changes, refactors, test-only changes, chores, and performance tuning with no user-visible effect. Anyone who wants the exact history reads the commits. When in doubt, ask a maintainer rather than adding a note by default.
**Mixed PRs** (both packages and server): Just add a changeset as usual. No `.server-changes/` file needed — the changeset covers it.
**Server-only PRs**: If your PR only changes `apps/webapp/`, `apps/supervisor/`, or other server components (and does NOT change anything in `packages/`) AND the change is user-facing, add a `.server-changes/` file.
**Package-only PRs**: Just add a changeset as usual.
**Mixed PRs** (both packages and server): the changeset covers it, so no `.server-changes/` file is needed. If the package change is internal and needs no changeset but the server change is user-facing, add a `.server-changes/` file for it.
**Package-only PRs**: Just add a changeset as usual, when the change is user-facing.
List API endpoints now clamp the page size to a maximum of 100. Requests asking for a larger page size return up to 100 items and keep paginating, rather than pulling an unbounded page.
Organizations without billing alerts now get default spend alert thresholds, so you're notified before usage grows unexpectedly. The billing limit page no longer pre-selects an option before you've set a limit and prompts you to configure one. Alert previews now update immediately after you change your billing limit.
When you create a Personal Access Token, the generated token now shows its first and last few characters instead of being fully hidden, so you can confirm you copied the right value.
Cut webapp CPU usage by about a quarter on the routes that workers call most, freeing headroom at the same request rate. Detailed event-loop blocking traces are no longer recorded by default, because producing them was itself a large part of that cost.
We use knip to control unused dependencies and code. It is enforced by CI `code-quality`.
Scan your code before pushing with:
```bash
pnpm run knip
```
If there are false positives, edit ./knip.json so that it passes.
### Imports
**Prefer static imports over dynamic imports.** Only use dynamic `import()` when:
@@ -92,7 +104,21 @@ Dynamic imports add unnecessary overhead in hot paths and make code harder to an
## Changesets and Server Changes
When modifying any public package (`packages/*` or `integrations/*`), add a changeset:
Changesets and `.server-changes/` files are **user-facing release notes**. They ship verbatim into the changelog that customers read to decide what to upgrade for or pay attention to. They are not a catalog of every change: anyone who wants the exact history reads the commits. So the question is not "did I touch a public package or a server app?" but **"would a user or customer care about this change?"**
**Add one** when the change is something a user would notice, act on, or want to hear about: a new feature, a bug fix they could have hit, a behavior or performance change they would feel, a breaking change.
**Skip it** (no changeset, no `.server-changes/` file) when the change is not worth communicating to users, even if it touches a public package or a server app. For example:
- internal-only or admin-only changes, refactors, test-only changes, chores
- performance or query tuning with no user-visible behavior change
- changes to a public package that is not consumed independently (e.g. `@trigger.dev/redis-worker`), where a version bump means nothing to a user
When in doubt, ask a maintainer rather than adding a note by default. An unnecessary entry is noise in the changelog, not a safe default.
### How to add one
When a **public package** (`packages/*` or `integrations/*`) change is user-facing, add a changeset:
```bash
pnpm run changeset:add
@@ -102,9 +128,9 @@ pnpm run changeset:add
- Confirm with maintainers before selecting **minor** (new features)
- **Never** select major without explicit approval
When modifying only server components (`apps/webapp/`, `apps/supervisor/`, etc.) with no package changes, add a `.server-changes/` file instead. See `.server-changes/README.md` for format and documentation.
When a **server-only** change (`apps/webapp/`, `apps/supervisor/`, etc., with no package changes) is user-facing, add a `.server-changes/` file instead. See `.server-changes/README.md` for format and documentation.
**Write the description for users, not maintainers.** Both changesets and `.server-changes/` notes ship verbatim in user-visible release notes. Lead with what changed *for the user* - one plain sentence describing behavior, not implementation, and never naming internal tools or infra. The full writing guidance in `.server-changes/README.md` applies to changesets too.
**Write the description for users, not maintainers.** Both changesets and `.server-changes/` notes ship verbatim in user-visible release notes. Lead with what changed *for the user*: one plain sentence describing behavior, not implementation, and never naming internal tools or infra. The full writing guidance in `.server-changes/README.md` applies to changesets too.
@@ -4,11 +4,13 @@ Trigger.dev uses [changesets](https://github.com/changesets/changesets) to manag
## Adding a changeset (package changes)
To add a changeset, use `pnpm run changeset:add` and follow the instructions [here](https://github.com/changesets/changesets/blob/main/docs/adding-a-changeset.md). Please only ever select one of our public packages when adding a changeset.
Changesets and `.server-changes/` files are user-facing release notes, not a catalog of every change. Add one only when the change is something a user would notice or acton. Skip it for internal-only changes, refactors, chores, and packages that are not consumed independently (e.g. `@trigger.dev/redis-worker`). Anyone who wants the exact history reads the commits.
To add a changeset, use `pnpm run changeset:add` and follow the [Changesets adding-a-changeset guide](https://github.com/changesets/changesets/blob/main/docs/adding-a-changeset.md). Please only ever select one of our public packages when adding a changeset.
## Adding a server change (server-only changes)
If your PR only changes server components (`apps/webapp/`, `apps/supervisor/`, etc.) and does NOT change any published packages, add a `.server-changes/` file instead of a changeset:
If your PR only changes server components (`apps/webapp/`, `apps/supervisor/`, etc.), does NOT change any published packages, AND the change is user-facing, add a `.server-changes/` file instead of a changeset:
For **mixed PRs** (both packages and server): just add a changeset. No `.server-changes/` file needed.
For **mixed PRs** (both packages and server): the changeset covers it, so no `.server-changes/` file is needed. If the package change is internal and needs no changeset but the server change is user-facing, add a `.server-changes/` file for it.
See `.server-changes/README.md` for full documentation.
## When to add which
Only for user-facing changes. Skip the note entirely for internal-only or admin-only changes, refactors, and chores.
| PR changes | What to add |
|---|---|
| Only packages (`packages/`) | Changeset (`pnpm run changeset:add`) |
| Only server (`apps/`) | `.server-changes/` file |
| Both packages and server | Just the changeset |
| Only packages (`packages/` or `integrations/`) | Changeset (`pnpm run changeset:add`), if the package change is user-facing |
| Only server (`apps/`) | `.server-changes/` file, if the server change is user-facing |
| Both packages and server | The changeset covers it; if the package change needs no changeset but the server change is user-facing, add a `.server-changes/` file |
@@ -214,6 +214,19 @@ pnpm exec trigger dev --log-level debug
5. Commit the generated migration files as well as the changes to `schema.prisma`.
6. If you're using VSCode you may need to restart the TypeScript server in the webapp to get updated type inference. Open a TypeScript file, then open the Command Palette (View > Command Palette) and run `TypeScript: Restart TS server`.
## Git hooks (lefthook)
We use [lefthook](https://lefthook.dev) for local git hooks, configured in `lefthook.yml` (the source of truth for what runs and when). Today that's a pre-push hook mirroring the CI `code-quality` checks; the set may grow, so check `lefthook.yml` rather than this guide.
Hooks install automatically on `pnpm install`. A failing hook prints exactly what to run to fix it.
**Opting out**
- GitButler skips hooks on `but push` unless you enable **Run hooks** in the project settings (off by default).
- Plain git: `LEFTHOOK=0 git push` / `--no-verify` to skip once; `pnpm exec lefthook uninstall` to remove.
This never affects correctness — CI enforces the same checks on every PR; the hooks just give you faster feedback.
## Making a pull request
**If you get errors, be sure to fix them before committing.**
@@ -225,10 +238,11 @@ pnpm exec trigger dev --log-level debug
1. **Always open your PR in draft status first.** Do not mark it as "Ready for Review" until the steps below are complete.
2. **Run format and lint locally before pushing:**
```bash
pnpm run format # auto-fixes formatting (oxfmt)
pnpm run lint:fix # auto-fixes lint violations (oxlint)
pnpm run format
pnpm run lint
pnpm run knip
```
Both are enforced by CI — the `code-quality` check will fail if either produces a diff or errors.
These are enforced by CI — the `code-quality` check will fail if either produces a diff or errors.
3. **Address all CodeRabbit code review comments.** Our CI runs an automated code review via CodeRabbit. Go through each comment and either fix the issue or resolve it with a comment explaining why no change is needed.
4. **Wait for all CI checks to pass.** Do not mark the PR as "Ready for Review" until every check is green.
5. **Then mark the PR as "Ready for Review"** so a maintainer can take a look.
@@ -247,7 +261,7 @@ If your change touches core infrastructure, modifies widely-used code paths, or
We use [changesets](https://github.com/changesets/changesets) to manage our package versions and changelogs. If you've never used changesets before, first read [their guide here](https://github.com/changesets/changesets/blob/main/docs/adding-a-changeset.md).
If you are contributing a change to any packages in this monorepo (anything in either the `/packages` or `/integrations` directories), then you will need to add a changeset to your Pull Requests before they can be merged.
Changesets are user-facing release notes, not a catalog of every change. If you are contributing a **user-facing** change to a package in this monorepo (anything in `/packages` or `/integrations` that a user would notice or act on), add a changeset to your Pull Request before it can be merged. Skip the changeset for internal-only changes, refactors, chores, and packages that are not consumed independently (e.g. `@trigger.dev/redis-worker`), where a version bump means nothing to a user.
To add a changeset, run the following command in the root of the repo
@@ -265,7 +279,7 @@ Most of the time the changes you'll make are likely to be categorized as patch r
## Adding server changes
Changesets only track published npm packages. If your PR only changes server components (`apps/webapp/`, `apps/supervisor/`, etc.) with no package changes, add a `.server-changes/` file so the change appears in release notes.
Changesets only track published npm packages. If your PR only changes server components (`apps/webapp/`, `apps/supervisor/`, etc.) with no package changes AND the change is user-facing, add a `.server-changes/` file so the change appears in release notes. Skip it for internal-only or admin-only changes, refactors, and chores.
Create a markdown file with a descriptive name:
@@ -286,13 +300,13 @@ EOF
The body text (below the frontmatter) is a one-line description of the change. Keep it concise — it will appear in release notes.
**When to add which:**
**When to add which** (only for user-facing changes; skip the note entirely for internal-only or admin-only changes, refactors, and chores):
| PR changes | What to add |
|---|---|
| Only packages (`packages/`) | Changeset |
| Only server (`apps/`) | `.server-changes/` file |
| Both packages and server | Just the changeset |
| Only packages (`packages/` or `integrations/`) | Changeset (if the package change is user-facing) |
| Only server (`apps/`) | `.server-changes/` file (if the server change is user-facing) |
| Both packages and server | The changeset covers it; if the package change needs no changeset but the server change is user-facing, add a `.server-changes/` file |
# Onboarding: taking over the hosted webhooks PR (#4344) for design
You are picking up **PR #4344 "hosted webhooks, agent channels, and human-in-the-loop"** to own the UX and front-end. This doc gets you from a clean machine to a running dashboard with realistic webhook data you can screenshot, restyle, and iterate on.
The feature is built and green (all backend plumbing, all four dashboard surfaces, the in-app test console). Your job is the visual and interaction design of the dashboard surfaces, not the backend. Everything below is oriented around that.
---
## 1. What you are designing
Hosted webhooks let a Trigger.dev user receive and verify a provider's webhooks (Stripe, GitHub, and so on) as a task, with no ingress or verification code of their own. A `webhook()` handler in their project gets a hosted URL; deliveries to that URL are verified, recorded, and routed to their `onEvent` handler.
The dashboard has **four surfaces you own**, all under the "Webhooks" nav section (teal icon):
| Surface | Route (under `/orgs/:org/projects/:project/env/:env`) | What it shows |
| --- | --- | --- |
| **Deliveries list** | `/webhooks` | Every delivery across all endpoints in the environment. Runs-style filter bar (Status, Webhook, Created, plus a More-filters menu for Delivery ID / Run ID), applied-filter pills, a Webhook column linking to the handler. This is the main screen. |
| **Delivery detail** | `/webhooks/deliveries/:deliveryParam` | One delivery. Main panel is a tabbed view (Event payload / Request headers) rendered as JSON. Sidebar property table (status badge, webhook + run links, external delivery id, idempotency key, timestamps, computed duration, error). Also has a friendly "not available / retained for N days" empty state for expired or bogus links. |
| **Handler detail + Console** | `/webhooks/:webhookParam` | The handler (the `webhook()` in the user's code). Tabs: Deliveries, Runs, Endpoints. This page also hosts the **Webhook Console / Composer** (see section 5), the tool you will lean on for data. |
| **Endpoint detail** | `/webhooks/endpoints/:endpointParam` | One endpoint. Left: scoped deliveries. Right: a **Connect** card (webhook URL, signing secret set/rotate/generate, provider setup rendered from the verifier config), Routing, Scope, Metadata. |
The status vocabulary, badges, and colors live in `components/webhookDeliveries/v1/DeliveryStatus.tsx` and `components/webhookEndpoints/v1/EndpointStatus.tsx`. The nav accent color is a Tailwind token `--color-webhooks` (teal), used via `text-webhooks`.
---
## 2. Get the code
You need the PR branch, `feat/hosted-webhook-ingress`.
gh pr checkout 4344# lands you on feat/hosted-webhook-ingress
```
If you plan to push design changes back to this branch, coordinate with Eric first: the branch is rebased and force-pushed periodically, so agree on timing or work on a child branch and open a follow-up.
Toolchain: pnpm 10.33.2 via corepack, Node 22+. Use `corepack pnpm` (a bare `pnpm` can be an old global that wipes `node_modules`).
```bash
corepack enable
corepack pnpm install
```
---
## 3. Bring the stack up
Four services and the webapp. Run from the repo root.
Now edit `.env` and add the two webhook-delivery replication lines (they are NOT in `.env.example`, and without them the Deliveries list looks empty even after you send webhooks, see section 5):
```bash
# webhook deliveries replication (required for the Deliveries list/detail to populate)
**Log in (dev):** open http://localhost:3030, submit the email `local@trigger.dev`. Dev auto-verifies the magic link (watch the webapp log for `/magic?token=`). That seeded user is an org admin, which matters for the next step.
---
## 4. Turn the feature on
The dashboard is gated by a feature flag, `hasWebhooksAccess` (default off).
- The seeded dev user `local@trigger.dev` is an **admin**, and admins bypass the flag, so on a fresh seed the Webhooks nav section is already visible to you. Nothing to do.
- If you use a non-admin user, set `featureFlags.hasWebhooksAccess = true` on the `Organization` row to reveal the nav section. (A global `FeatureFlag` row with key `hasWebhooksAccess` makes the pages reachable by URL, but the left nav reads only org-level flags, so the section stays hidden for non-admins.)
If the "Webhooks" section is missing from the left nav, this flag is why.
---
## 5. Get nice data (the part that matters)
Delivery rows are what make these screens interesting: a spread of providers, statuses, payloads, timestamps. Here is how the data flows and how to produce it.
### The pipeline (why an empty list is usually a setup issue, not a bug)
`ingest -> engine (verify, filter, route) -> Postgres WebhookDelivery rows -> replication -> ClickHouse`. The Deliveries **list orders and paginates from ClickHouse**, then hydrates every visible field from Postgres. So if replication is off (section 3), you can create deliveries and still see an empty list. Enable the two replication env vars and restart the webapp.
One caveat baked into the design: replication starts streaming from the moment it is enabled, so deliveries written **before** you turned it on will not appear. Turn replication on first, then generate data.
### Fastest path: the seed script
There is a seed script that inserts a full, stable dataset directly into both stores (Postgres and ClickHouse), so you get realistic screens on a fresh DB with no workers, no `trigger dev`, and no signing secrets to set:
```bash
corepack pnpm --filter webapp run db:seed:webhooks
# optional: deliveries per endpoint (default 45)
corepack pnpm --filter webapp run db:seed:webhooks -- 60
```
It creates six endpoints across different providers and verifier schemes (Stripe, GitHub, Slack, Svix, Discord, and a custom shared-secret one, with a mix of active/inactive and secret-set/not-set), then a spread of deliveries over the last two weeks covering **every** delivery status (SUCCEEDED, FAILED, FILTERED, PENDING, PROCESSING), realistic per-provider payloads and headers, and a mix of test and live. It attaches to the first DEVELOPMENT environment your local user can see (set `WEBHOOK_SEED_PROJECT="<project name>"` to target a specific one), and prints the exact Deliveries URL when it finishes. Re-running clears and reseeds that environment, so you always get the same clean dataset. The script is `apps/webapp/seed-webhook-deliveries.ts`; edit the `ENDPOINTS` array or the status weights to shape the data to whatever you are designing.
Because it writes the ClickHouse rows directly, seeded data shows up **without** the replication setup in section 3. That replication env is only needed for the live and Composer paths below. (The seed uses `WEBHOOK_DELIVERIES_REPLICATION_CLICKHOUSE_URL` if set, otherwise `CLICKHOUSE_URL`, which is already in `.env.example`.)
This is the recommended way to get data. The interactive paths below are for exercising the live pipeline (real verification, real routed runs) or the in-app test console.
### Interactive: create an endpoint (one-time)
The Composer sends to an endpoint, and endpoints only exist once a Trigger project that declares a `webhook()` has been dev-run or deployed. Quickest path: a tiny demo project.
// event is the parsed body, headers is a Web Headers object
},
});
// A real provider, for realistic payloads:
exportconststripeWebhook=webhook({
id:"stripe-webhook",
source: webhooks.stripe(),
onEvent: async({event})=>{},
});
```
Link that demo project to your local build and run `trigger dev` (see `AGENTS.md` "Testing with the hello-world Reference Project" for linking; the `triggerdotdev/references` repo has ready-made projects). Running `trigger dev` registers the `webhook()` handlers, which creates their endpoints. Set each endpoint's signing secret from the **endpoint detail Connect card** (Generate or paste).
### Interactive: fire deliveries with the Webhook Console
Open the handler detail page (`/webhooks/:webhookParam`). It hosts the **Composer** (`components/webhookConsole/WebhookComposer.tsx`). It has four source tabs and four signature modes, and it injects the delivery straight through the engine in-process, so it is fast and does not consume any real rate budget:
- **Sample tab**: pick a real provider event from the built-in catalog (`@internal/webhook-sources`, six first-class providers plus a large sample manifest). This is the fastest way to get realistic Stripe / GitHub / Svix / Square / Discord payloads with correct-looking headers.
- **Body tab**: hand-write any JSON.
- **Replay tab**: re-send a prior delivery.
- **AI tab**: generate a payload with a prompt.
- **Signature modes** `signed | unsigned | tampered | simulate`: this is how you produce a **spread of delivery statuses**. `signed` (with a secret set) verifies and routes to a SUCCEEDED delivery; `unsigned` and `tampered` produce failed/rejected deliveries. Send a mix to populate every status badge you need to design.
To get SUCCEEDED deliveries whose **runs** also complete (nicest end-to-end data), keep the demo project's `trigger dev` running so the routed task actually executes.
### Interactive: a real provider (most realistic)
For genuine payloads and headers, point the Stripe CLI at an endpoint: `stripe listen --forward-to http://localhost:3030/webhooks/v1/ingest/<opaqueId>`, set that endpoint's `whsec` via the Connect card, then `stripe trigger payment_intent.succeeded`.
| Data (presenters, read-only from your side) | `apps/webapp/app/presenters/v3/WebhookDeliveriesListPresenter.server.ts`, `WebhookDeliveryDetailPresenter.server.ts`, `WebhookDetailPresenter.server.ts`, `webhookComposerEndpoints.server.ts` |
| Nav entry | `apps/webapp/app/components/navigation/SideMenu.tsx` (the `staticSections` "webhooks" push) |
| Accent color token | `apps/webapp/app/tailwind.css` (`--color-webhooks`, used as `text-webhooks`) |
| Data seed script | `apps/webapp/seed-webhook-deliveries.ts` (run via `db:seed:webhooks`) |
**Styling:** the webapp is on Tailwind v4 (CSS-first `@theme` in `apps/webapp/app/tailwind.css`, there is no `tailwind.config.js`). Add or change design tokens there.
**Design language to match:** these screens deliberately reuse the Runs page primitives (the filter bar is built from `RunFilters` / `SharedFilters`, the tables mirror the Runs table cells). Match the Runs and Sessions pages, not a new visual system.
---
## 7. Iterating
- **HMR vs restart:** editing a component (`.tsx`) hot-reloads. Editing a `.server.ts` file makes the Remix dev server restart the app (a brief connection refused, then it comes back). Editing Tailwind tokens hot-reloads.
- **Screenshots:** capture from the running dashboard at http://localhost:3030. Save shots outside the repo or to a scratch folder so they do not get committed.
- **Typecheck after non-trivial changes:** `corepack pnpm run typecheck --filter webapp` (about 1 to 2 minutes). For small style tweaks, trust it and let CI catch anything.
- **One boundary gotcha that the dev server will NOT catch:** route files must not leak server-only imports into the client bundle. The dev server tolerates it, but the production build fails. If you touch a route file and import anything server-only, run `corepack pnpm --filter webapp run build:remix` before pushing. Pure component and style edits are unaffected.
---
## 8. Shipping your changes
Follow the repo PR workflow:
- Format and lint before committing: `corepack pnpm run format` (oxfmt) and `corepack pnpm run lint:fix` (oxlint). CI enforces both.
- Commit style is Conventional Commits, for example `feat(webapp): redesign webhook deliveries table`. No emoji, no attribution footer.
- The PR is a **draft** awaiting an AI review pass, then a human review, before it flips to ready. Do not flip it to ready yourself; push your commits and let Eric coordinate the review and any rebase onto `main`.
- CI to expect: `code-quality` (oxfmt + oxlint), `typecheck`, webapp unit shards, and the Playwright `e2e-webapp` job. Style-only changes usually only risk `code-quality`.
---
## 9. Quick reference
- **Webapp:** http://localhost:3030 (port comes from `REMIX_APP_PORT`, falling back to `PORT`/3030).
- **Seed data:** `corepack pnpm --filter webapp run db:seed:webhooks` (append `-- <n>` for deliveries per endpoint).
- **Must-set env for data to show:** `WEBHOOK_DELIVERIES_REPLICATION_ENABLED=1` and `WEBHOOK_DELIVERIES_REPLICATION_CLICKHOUSE_URL=http://default:password@localhost:8123`.
- **Login:** `local@trigger.dev`, magic link auto-verifies in dev.
- **Feature docs:** `docs/webhooks/` (overview, sources, connect, deliveries, channels, human-in-the-loop). Read `overview.mdx` and `deliveries.mdx` first for the mental model behind the screens.
A user writes a `webhook()` in their project. On deploy (or `trigger dev`) that handler gets one or more hosted endpoints, each with a signing secret. A provider POSTs to the endpoint's URL; the engine verifies the signature, optionally filters, records a `WebhookDelivery`, and triggers the routed task run. The dashboard reads those deliveries: the list orders them out of ClickHouse and hydrates the rest from Postgres, the detail page reads Postgres directly (it holds the only copy of the event payload and headers). Everything you design sits on top of that delivery record and the endpoint that produced it.
message:`Org "${orgId}" pins run pods to the large-machine pool, but non-large presets are required to stay off it, so those runs would never schedule. Use a different pool or disable KUBERNETES_LARGE_MACHINE_AFFINITY_ENABLED.`,
"DELETE_CHECKPOINTS_ON_COMPLETION needs WORKLOAD_TOKEN_ENFORCEMENT set to log or enforce: the tenancy it deletes by comes from the deployment token, so with tokens disabled it would silently reclaim nothing",
message:`Invalid toleration format (empty key): "${entry}"`,
});
returnz.NEVER;
}
if(!isQualifiedName(key)){
ctx.addIssue({
code: z.ZodIssueCode.custom,
message:`Invalid toleration key "${key}" in "${entry}". Must be a Kubernetes taint key, optionally prefixed with a DNS subdomain.`,
});
returnz.NEVER;
}
if(eqIdx===-1){
return{key,operator:"Exists"asconst,effect};
}
constvalue=keyValue.slice(eqIdx+1).trim();
if(!value){
logger.warn(
'Toleration has an empty value, so it matches only a taint whose value is also empty. Drop the "=" to tolerate any value of this key.',
{entry,key}
);
}
if(!isLabelValue(value)){
ctx.addIssue({
code: z.ZodIssueCode.custom,
message:`Invalid toleration value "${value}" in "${entry}". Must be a Kubernetes label value: alphanumeric, with dashes, underscores and dots inside.`,
});
returnz.NEVER;
}
return{
key,
operator:"Equal"asconst,
value,
effect,
};
});
});
/**
* Scalar values are coerced: YAML/JSON easily produce `true` or `3` where a label
* value is meant, and Kubernetes label values are always strings. An empty value
* is rejected rather than passed through - as a selector it matches only nodes
* carrying a literal empty-valued label, which pins the org to nothing.
message:`Invalid node selector key "${rawKey}". Must be a Kubernetes label key, optionally prefixed with a DNS subdomain.`,
});
continue;
}
if(!value){
ctx.addIssue({
code: z.ZodIssueCode.custom,
message:`Empty node selector value for key "${key}". Remove the key instead of blanking the value.`,
});
continue;
}
if(!isLabelValue(value)){
ctx.addIssue({
code: z.ZodIssueCode.custom,
message:`Invalid node selector value "${value}" for key "${key}". Must be a Kubernetes label value: alphanumeric, with dashes, underscores and dots inside, at most 63 characters.`,
});
continue;
}
result[key]=value;
}
returnresult;
});
/**
* Per-organization placement overrides for run pods, as JSON keyed by the
* What the agent is asked when it's opened from a deployment setup panel. The panel is the docs
* answer; the agent is for the part the docs can't answer — this project, this environment.
*/
constASK_AGENT_DEPLOY_PROMPT=
"I'm trying to deploy my tasks to this environment. Walk me through it and tell me if anything about this project or environment is going to get in the way.";
/** The docs links the deployment panels offer to anyone without the agent. */
functionDeployDocsLinks() {
return(
<>
<SimpleTooltip
asChild
tabbable
button={
// Span wrapper: LinkButton drops the pointer-event props Radix injects via asChild, so
// the tooltip trigger has to be a plain element (same pattern as FavoritePageButton).
Some files were not shown because too many files have changed in this diff
Show More
Reference in New Issue
Block a user
Blocking a user prevents them from interacting with repositories, such as opening or commenting on pull requests or issues. Learn more about blocking a user.
 Dan Sutton