 Eric Allam
951d8e8d7b
Eric Allam
951d8e8d7b
## What

Follow-up to #4539. The driver-adapter work is inert until a client
flips to the pg driver adapter, but the moment one does, our database
observability degrades: the OTel metrics pipeline reads pool stats from
Prisma's `$metrics`, which is owned by the Rust engine's `quaint` pool.
Under the adapter, `pg.Pool` owns the pool, so those gauges read zero.
The pipeline also only ever scraped a single client (the control-plane
writer singleton).

This PR makes database metrics driver-agnostic and per-client:

- Every configured client registers a metrics source: control-plane
writer/replica, run-ops writer/replica, legacy writer/replica.
Previously only the control-plane writer singleton was scraped.
- Each OTel instrument is observed per client with `db_client` and
`db_driver` (`quaint` | `pg-adapter`) attributes. `db_client` uses our
canonical datasource-role labels (`control-plane-writer`,
`control-plane-replica`, `run-ops-writer`, `run-ops-replica`,
`legacy-run-ops-writer`, `legacy-run-ops-replica`) — the same strings
used for the `db.datasource` span attribute, so a metric and a trace
point at the same pool.
- Pool figures come from the authoritative source per driver:
- **pg-adapter**: `pg.Pool` (`totalCount`/`idleCount`/`waitingCount`,
plus cumulative opened/closed from `connect`/`remove` events).
- **quaint**: the Rust engine's `$metrics` pool gauges/counters, exactly
as before.
- Query counters and duration histograms still come from `$metrics` for
both drivers (the Rust engine executes queries in both cases).
- New `db.pool.connections.waiting` gauge (pg.Pool exposes this; quaint
reports 0).
- Stops exporting Prisma metrics from the Prometheus `/metrics` route.
Pool observability now lives entirely in the OTel pipeline, per driver,
per client.

## Why

So we can flip any client (including the control-plane writer, the
primary desync-fix target) to the driver adapter without losing pool
visibility. Existing dashboards keyed on the same metric names keep
working; they gain a per-client dimension.

## Testing

Unit (`apps/webapp/app/utils/databaseMetrics.server.test.ts`): the pure
normalizer — quaint reads pool from `$metrics`; adapter reads pool from
`pg.Pool` and keeps engine query metrics; `busy` never goes negative;
graceful zeroing when `$metrics` is unavailable (adapter still reports
live pool figures).

Live smoke test against a prod-shaped local stack: three
physically-distinct Postgres DBs (control-plane, run-ops, legacy) behind
dual PgBouncers, split mode on, with a mix of adapter and quaint
clients. Reading the actual emitted OTel metrics, every pool shows up as
its own series:

```
db.pool.connections.total{db_client="control-plane-writer",  db_driver="pg-adapter"} = 1
db.pool.connections.total{db_client="control-plane-replica", db_driver="quaint"}     = 1
db.pool.connections.total{db_client="run-ops-writer",        db_driver="pg-adapter"} = 1
db.pool.connections.total{db_client="run-ops-replica",       db_driver="quaint"}     = 1
db.pool.connections.total{db_client="legacy-run-ops-writer", db_driver="quaint"}     = 1
db.pool.connections.total{db_client="legacy-run-ops-replica",db_driver="quaint"}     = 1
db.client.queries.total{db_client="control-plane-writer",db_driver="pg-adapter"} = incrementing
db.client.queries.duration.count{db_client="control-plane-writer",db_driver="pg-adapter"} = incrementing
```

Confirms: metrics are attributed per pool with the correct driver;
adapter pools' figures come from `pg.Pool`; and query counters/duration
histograms keep incrementing under the pg adapter. Also verified
`/metrics` (Prometheus) now returns zero `prisma_*` series while still
serving the app's own metrics.

`pnpm run typecheck --filter webapp` passes.

## Notes

- `/metrics` (Prometheus) no longer includes `prisma_*` series. Anything
scraping that endpoint for Prisma metrics should read the equivalent
`db.*` metrics from the OTel exporter instead.
- **PgBouncer + `?schema=` gotcha (separate from this PR, worth flagging
for rollout):** since #4539 parses `?schema=` from the DSN and passes `{
schema }` to the adapter, node-postgres sends `search_path` as a startup
parameter. A transaction-mode PgBouncer rejects that with `FATAL:
unsupported startup parameter: search_path`. Our prod control-plane DSNs
use the default `public` schema with no `?schema=` param, so this is
latent, but any client we flip to the adapter must not carry `?schema=`
in its DSN (or the pooler needs `ignore_startup_parameters =
search_path`).

---------

Co-authored-by: Claude Opus 4.8 (1M context) <noreply@anthropic.com>

Build and deploy fully‑managed AI agents and workflows
Website | Docs | Issues | Example projects | Feature requests | Public roadmap | Self-hosting








About Trigger.dev
Trigger.dev is the open-source platform for building AI workflows in TypeScript. Long-running tasks with retries, queues, observability, and elastic scaling.
The platform designed for building AI agents
Build AI agents using all the frameworks, services and LLMs you're used to, deploy them to Trigger.dev and get durable, long-running tasks with retries, queues, observability, and elastic scaling out of the box.
-
Long-running without timeouts: Execute your tasks with absolutely no timeouts, unlike AWS Lambda, Vercel, and other serverless platforms.
-
Durability, retries & queues: Build rock solid agents and AI applications using our durable tasks, retries, queues and idempotency.
-
True runtime freedom: Customize your deployed tasks with system packages – run browsers, Python scripts, FFmpeg and more.
-
Human-in-the-loop: Programmatically pause your tasks until a human can approve, reject or give feedback.
-
Realtime apps & streaming: Move your background jobs to the foreground by subscribing to runs or streaming AI responses to your app.
-
Observability & monitoring: Each run has full tracing and logs. Configure error alerts to catch bugs fast.
Key features:
- JavaScript and TypeScript SDK - Build background tasks using familiar programming models
- Long-running tasks - Handle resource-heavy tasks without timeouts
- Durable cron schedules - Create and attach recurring schedules of up to a year
- Trigger.dev Realtime - Trigger, subscribe to, and get real-time updates for runs, with LLM streaming support
- Build extensions - Hook directly into the build system and customize the build process. Run Python scripts, FFmpeg, browsers, and more.
- React hooks - Interact with the Trigger.dev API on your frontend using our React hooks package
- Batch triggering - Use batchTrigger() to initiate multiple runs of a task with custom payloads and options
- Structured inputs / outputs - Define precise data schemas for your tasks with runtime payload validation
- Waits - Add waits to your tasks to pause execution for a specified duration
- Preview branches - Create isolated environments for testing and development. Integrates with Vercel and git workflows
- Waitpoints - Add human-in-the-loop judgment at critical decision points without disrupting workflow
- Concurrency & queues - Set concurrency rules to manage how multiple tasks execute
- Multiple environments - Support for DEV, PREVIEW, STAGING, and PROD environments
- No infrastructure to manage - Auto-scaling infrastructure that eliminates timeouts and server management
- Automatic retries - If your task encounters an uncaught error, we automatically attempt to run it again
- Checkpointing - Tasks are inherently durable, thanks to our checkpointing feature
- Versioning - Atomic versioning allows you to deploy new versions without affecting running tasks
- Machines - Configure the number of vCPUs and GBs of RAM you want the task to use
- Observability & monitoring - Monitor every aspect of your tasks' performance with comprehensive logging and visualization tools
- Logging & tracing - Comprehensive logging and tracing for all your tasks
- Tags - Attach up to ten tags to each run, allowing you to filter via the dashboard, realtime, and the SDK
- Run metadata - Attach metadata to runs which updates as the run progresses and is available to use in your frontend for live updates
- Bulk actions - Perform actions on multiple runs simultaneously, including replaying and cancelling
- Real-time alerts - Choose your preferred notification method for run failures and deployments
Write tasks in your codebase
Create tasks where they belong: in your codebase. Version control, localhost, test and review like you're already used to.
import { task } from "@trigger.dev/sdk";

//1. You need to export each task
export const helloWorld = task({
  //2. Use a unique id for each task
  id: "hello-world",
  //3. The run function is the main function of the task
  run: async (payload: { message: string }) => {
    //4. You can write code that runs for a long time here, there are no timeouts
    console.log(payload.message);
  },
});
Deployment
Use our SDK to write tasks in your codebase. There's no infrastructure to manage, your tasks automatically scale and connect to our cloud. Or you can always self-host.
Environments
We support Development, Staging, Preview, and Production environments, allowing you to test your tasks before deploying them to production.
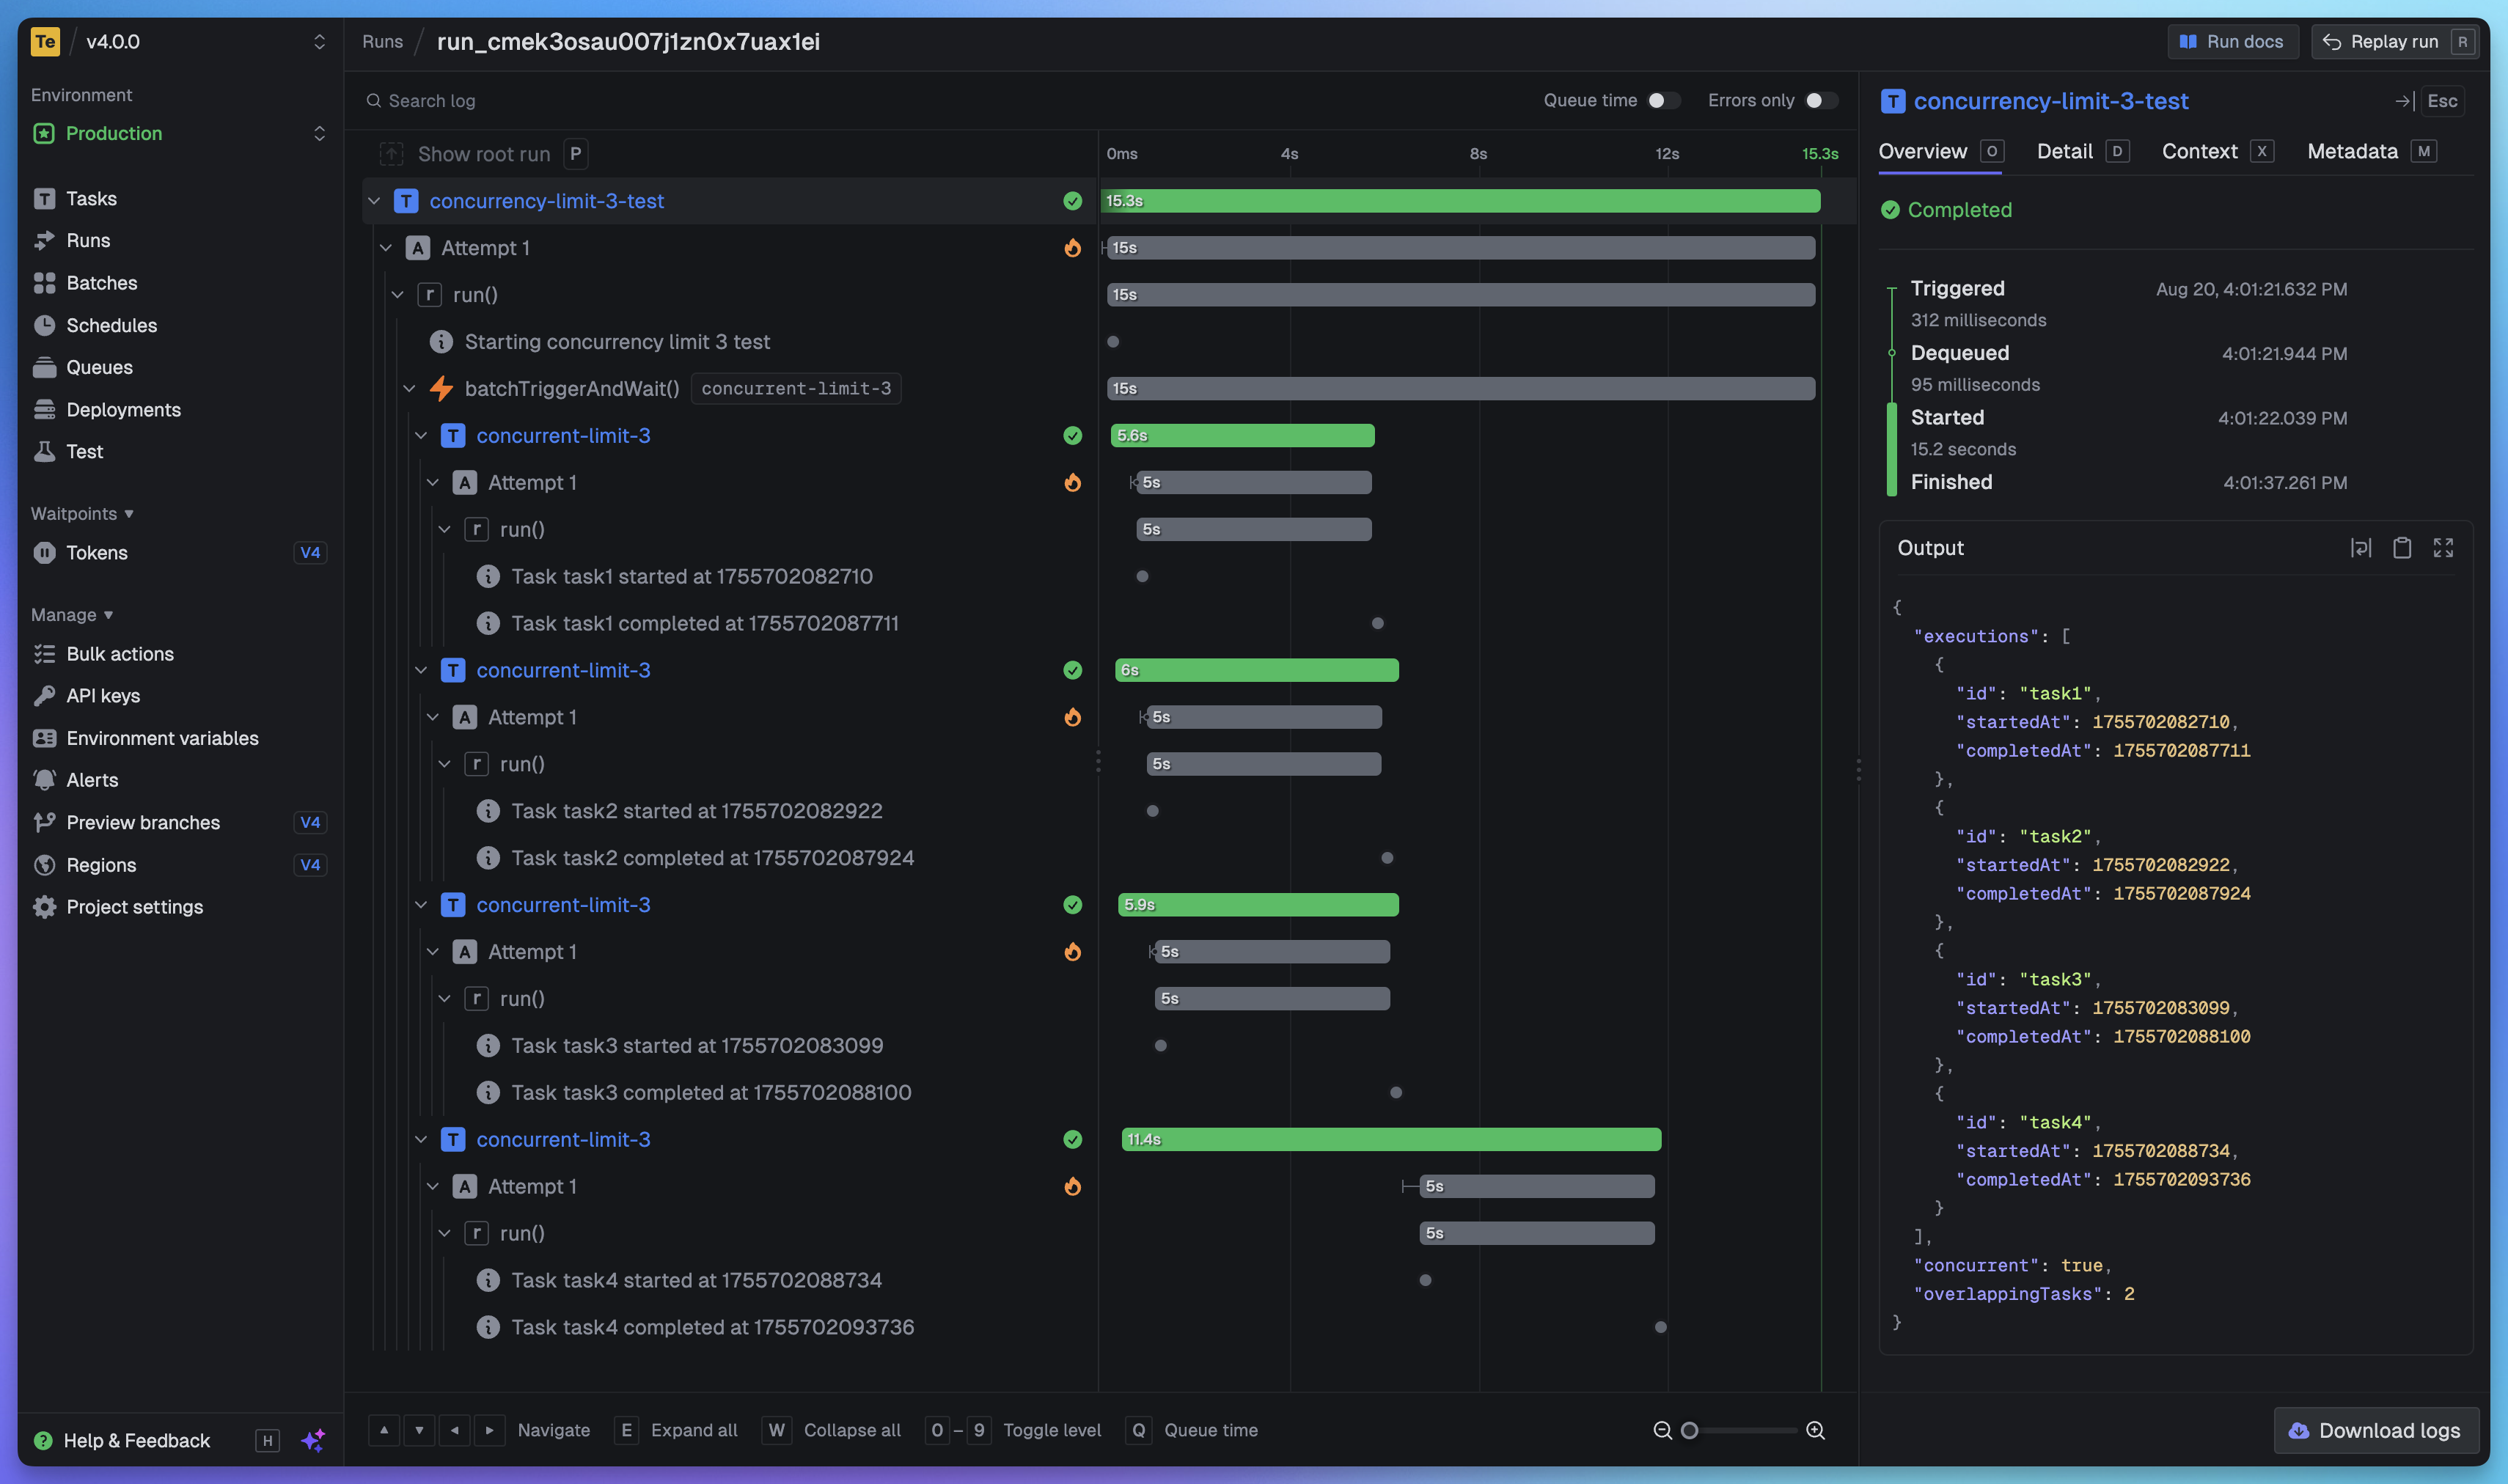
Full visibility of every job run
View every task in every run so you can tell exactly what happened. We provide a full trace view of every task run so you can see what happened at every step.
Getting started
The quickest way to get started is to create an account and project in our web app, and follow the instructions in the onboarding. Build and deploy your first task in minutes.
Useful links:
- Quick start - get up and running in minutes
- How it works - understand how Trigger.dev works under the hood
- Guides and examples - walk-through guides and code examples for popular frameworks and use cases
Self-hosting
If you prefer to self-host Trigger.dev, you can follow our self-hosting guides:
- Docker self-hosting guide - use Docker Compose to spin up a Trigger.dev instance
- Kubernetes self-hosting guide - use our official Helm chart to deploy Trigger.dev to your Kubernetes cluster
Support and community
We have a large active community in our official Discord server for support, including a dedicated channel for self-hosting.
Development
To setup and develop locally or contribute to the open source project, follow our development guide.