 Eric Allam
9d57aff542
Eric Allam
9d57aff542
## Summary

The four charts above the queues table aggregated over **at most the 25
queues on the current page**. They reused the loader's already-paginated
queue array as a ClickHouse `queue IN (...)` filter, so paging or
re-sorting changed the values, and a name search matching nothing
blanked the whole chart row. The stat tiles above them were already
environment-wide, so the two rows disagreed.

They now read `env_metrics`, the environment-level rollup that already
exists for exactly this (the built-in Queues dashboard and the health
report read it). That is both correct and queue-count-independent: no
`GROUP BY queue` across an entire environment, and no client-side
summing.

Note this is not only a paging artifact: page 1 under-reported too. On
the seeded environment below, page 1 read 82% saturation against a true
87%, because the environment's running total is not the sum of one page
of per-queue gauges.

Three related fixes ride along.

**Scheduling delay and throttling sawed to zero.** Both are
event-driven, so at the 10-second bucket a short range picks, most
buckets hold no samples at all and were drawn as `0ms`. Measured over a
1-hour window: **232 of 349 buckets had no scheduling-delay samples**. A
bucket where nothing started is not a bucket where nothing waited, so
the line was both ugly and wrong. TRQL grows a `minBucketSeconds` floor,
plumbed through the metric resource route, and the hero tiles set 60s.
Buckets that still have no samples render as a gap instead of a dive to
zero.

**The floor must not feed a width-dependent headline.** Two of the four
headlines are not peaks, so widening the plotted buckets moved them:

- **Throttled** is a share of buckets that saw any throttling, so a
single brief throttle came to mark a whole minute instead of ten
seconds: the same seeded events read 17% at 10s and 85% at 60s.
- **Scheduling delay p95** is a percentile, and merging quantile states
over a wider bucket yields a p95 between the sub-buckets' own. Two 240s
samples among twenty in one 10-second sub-bucket give a worst-of-six p95
of 240,000ms against a merged 60-second p95 of 5,000ms — a 48x
understatement of a headline whose tooltip claims it is the worst in the
window.

Both charts keep the floor, since a readable line was the point of it.
Their headlines now come from a second query at the range's natural
bucket width, via an optional `readout` on the tile, so each means what
its tooltip says regardless of how the plotted buckets are sized.
Saturation and backlog are genuinely width-invariant (a max of maxes is
the same at any width), so they are unchanged and issue no extra query.
Both caught by Devin in review; I had wrongly lumped p95 in with the
peaks.

**Charts reported a hydration mismatch on every render.** Recharts
resolved victory-vendor's CJS entry on the server and its ESM entry in
the browser. Those bundle different d3-shape builds, and the CJS one
predates d3-path's digit rounding, so every server-rendered curve
carried full-precision coordinates while the client rounded to 3
decimals:

```
Server: M0,3C0.9305555555555555,3,1.8611111111111112,3,...
Client: M0,3C0.931,3,1.861,3,...
```

Bundling recharts for SSR makes both sides resolve the same ESM build.
Verified: 45 of 45 server-rendered chart curves now match the client,
and the page loads with an empty console.

## Verification

An isolated stack with 40 seeded queues (20 heavily loaded, 20 idle) and
90 minutes of 10-second buckets written into `queue_metrics_raw_v1`, so
the real materialized views built `queue_metrics_v1`, `env_metrics_v1`
and the 5m rollup. Ground truth for the environment: 260 running against
a limit of 300 (**87% saturation**), 800 queued.

| | before | after |
| -- | -- | -- |
| Saturation, page 1 | 82% peak | **87% peak** |
| Saturation, page 2 | 5% peak | **87% peak** |
| Backlog / delay, page 2 | "No activity" | **800 peak / 59.5s** |
| Name search matching nothing | all four charts blank | charts stay
environment-wide |
| Metric refetches on a page change | 4, each painting a skeleton | **0,
no skeleton** |
| Buckets drawn as 0ms with no samples | 232 of 349 | **0** |
| Throttled readout | 17% | **17%**, unchanged by the wider buckets |
| Worst-p95 readout source | plotted buckets | **natural width**, so a
sub-minute spike is not averaged away |
| Crosshair reach, hovering one detail-page chart | 2 of 4 others | **4
of 4** |
| SSR chart curves mismatching the client | 45 | **0** |

The bucket floor was measured across ranges: it widens 10s to 60s at 30m
and 1h, and is correctly a no-op at 12h (300s) and 7d (3600s). One extra
request per page load, for the throttled readout.

The built-in Queues dashboard, which reads `env_metrics` independently,
agrees at 86.7% and 260 of 300.

`internal-packages/tsql` suite green (612 tests), including 5 new ones
for the floor that fail without it. Webapp typecheck, oxfmt and oxlint
clean. Spot-checked the Run metrics dashboard and the per-queue detail
page for SSR regressions from bundling recharts: both render, console
clean.

The queue detail page carries the same event-driven series, so its
scheduling delay, throttling and per-key mean delay take the same
treatment.

## Screenshots

<img width="2540" height="580" alt="after-page1-charts"
src="https://github.com/user-attachments/assets/6cd23f9c-e7fd-4918-bcfa-b1d3340b16d1"
/>

## Rollout

Already behind the per-organization `queueMetricsUiEnabled` flag, so
only gated orgs see any of it. Blast radius is chart values on one page
plus the SSR bundling of recharts; rollback is a revert with no data
migration.

## Stated limitations

- `wait_ms_count` and the quantile state both only count `wait_ms > 0`,
so "nothing started in this bucket" and "everything started instantly"
are indistinguishable in storage. Both render as a gap. Distinguishing
them needs a schema change, which is not in this PR.
- The queue name search deliberately no longer narrows the charts. It
only did so incidentally and incorrectly before (first 25 matches, and
blanked on zero matches). Search-scoped charts would need the full
unpaginated matching set and a server-side aggregate; worth its own
ticket if we want it.
- Bundling recharts for SSR grows the server bundle slightly. That is
the cost of both sides resolving one d3-shape build.
- The plotted delay line is a smoothed 60-second view, so a sub-minute
spike above the one-minute warning threshold can fail to colour the line
even though the headline reports it and colours itself.
- Every chart inside one synced group shares the floor, because the
hover crosshair is a reference line on a category x-axis and only draws
where the hovered bucket exists in the other chart's own data. That
costs the queue detail page's gauges some resolution (1 minute instead
of 10 seconds) in exchange for the crosshair working across the row.

Separately, while taking the screenshots I found a pre-existing
rendering bug unrelated to this change: a **perfectly flat** saturation
series draws no line at all (the readout still shows the right
percentage), which looks like the threshold gradient's offset
degenerating when the series min equals its max. It reproduces on
`main`, so it is not a regression here and I have left it alone; filed
as its own issue.

Refs TRI-12784

Build and deploy fully‑managed AI agents and workflows
Website | Docs | Issues | Example projects | Feature requests | Public roadmap | Self-hosting








About Trigger.dev
Trigger.dev is the open-source platform for building AI workflows in TypeScript. Long-running tasks with retries, queues, observability, and elastic scaling.
The platform designed for building AI agents
Build AI agents using all the frameworks, services and LLMs you're used to, deploy them to Trigger.dev and get durable, long-running tasks with retries, queues, observability, and elastic scaling out of the box.
-
Long-running without timeouts: Execute your tasks with absolutely no timeouts, unlike AWS Lambda, Vercel, and other serverless platforms.
-
Durability, retries & queues: Build rock solid agents and AI applications using our durable tasks, retries, queues and idempotency.
-
True runtime freedom: Customize your deployed tasks with system packages – run browsers, Python scripts, FFmpeg and more.
-
Human-in-the-loop: Programmatically pause your tasks until a human can approve, reject or give feedback.
-
Realtime apps & streaming: Move your background jobs to the foreground by subscribing to runs or streaming AI responses to your app.
-
Observability & monitoring: Each run has full tracing and logs. Configure error alerts to catch bugs fast.
Key features:
- JavaScript and TypeScript SDK - Build background tasks using familiar programming models
- Long-running tasks - Handle resource-heavy tasks without timeouts
- Durable cron schedules - Create and attach recurring schedules of up to a year
- Trigger.dev Realtime - Trigger, subscribe to, and get real-time updates for runs, with LLM streaming support
- Build extensions - Hook directly into the build system and customize the build process. Run Python scripts, FFmpeg, browsers, and more.
- React hooks - Interact with the Trigger.dev API on your frontend using our React hooks package
- Batch triggering - Use batchTrigger() to initiate multiple runs of a task with custom payloads and options
- Structured inputs / outputs - Define precise data schemas for your tasks with runtime payload validation
- Waits - Add waits to your tasks to pause execution for a specified duration
- Preview branches - Create isolated environments for testing and development. Integrates with Vercel and git workflows
- Waitpoints - Add human-in-the-loop judgment at critical decision points without disrupting workflow
- Concurrency & queues - Set concurrency rules to manage how multiple tasks execute
- Multiple environments - Support for DEV, PREVIEW, STAGING, and PROD environments
- No infrastructure to manage - Auto-scaling infrastructure that eliminates timeouts and server management
- Automatic retries - If your task encounters an uncaught error, we automatically attempt to run it again
- Checkpointing - Tasks are inherently durable, thanks to our checkpointing feature
- Versioning - Atomic versioning allows you to deploy new versions without affecting running tasks
- Machines - Configure the number of vCPUs and GBs of RAM you want the task to use
- Observability & monitoring - Monitor every aspect of your tasks' performance with comprehensive logging and visualization tools
- Logging & tracing - Comprehensive logging and tracing for all your tasks
- Tags - Attach up to ten tags to each run, allowing you to filter via the dashboard, realtime, and the SDK
- Run metadata - Attach metadata to runs which updates as the run progresses and is available to use in your frontend for live updates
- Bulk actions - Perform actions on multiple runs simultaneously, including replaying and cancelling
- Real-time alerts - Choose your preferred notification method for run failures and deployments
Write tasks in your codebase
Create tasks where they belong: in your codebase. Version control, localhost, test and review like you're already used to.
import { task } from "@trigger.dev/sdk";

//1. You need to export each task
export const helloWorld = task({
  //2. Use a unique id for each task
  id: "hello-world",
  //3. The run function is the main function of the task
  run: async (payload: { message: string }) => {
    //4. You can write code that runs for a long time here, there are no timeouts
    console.log(payload.message);
  },
});
Deployment
Use our SDK to write tasks in your codebase. There's no infrastructure to manage, your tasks automatically scale and connect to our cloud. Or you can always self-host.
Environments
We support Development, Staging, Preview, and Production environments, allowing you to test your tasks before deploying them to production.
Full visibility of every job run
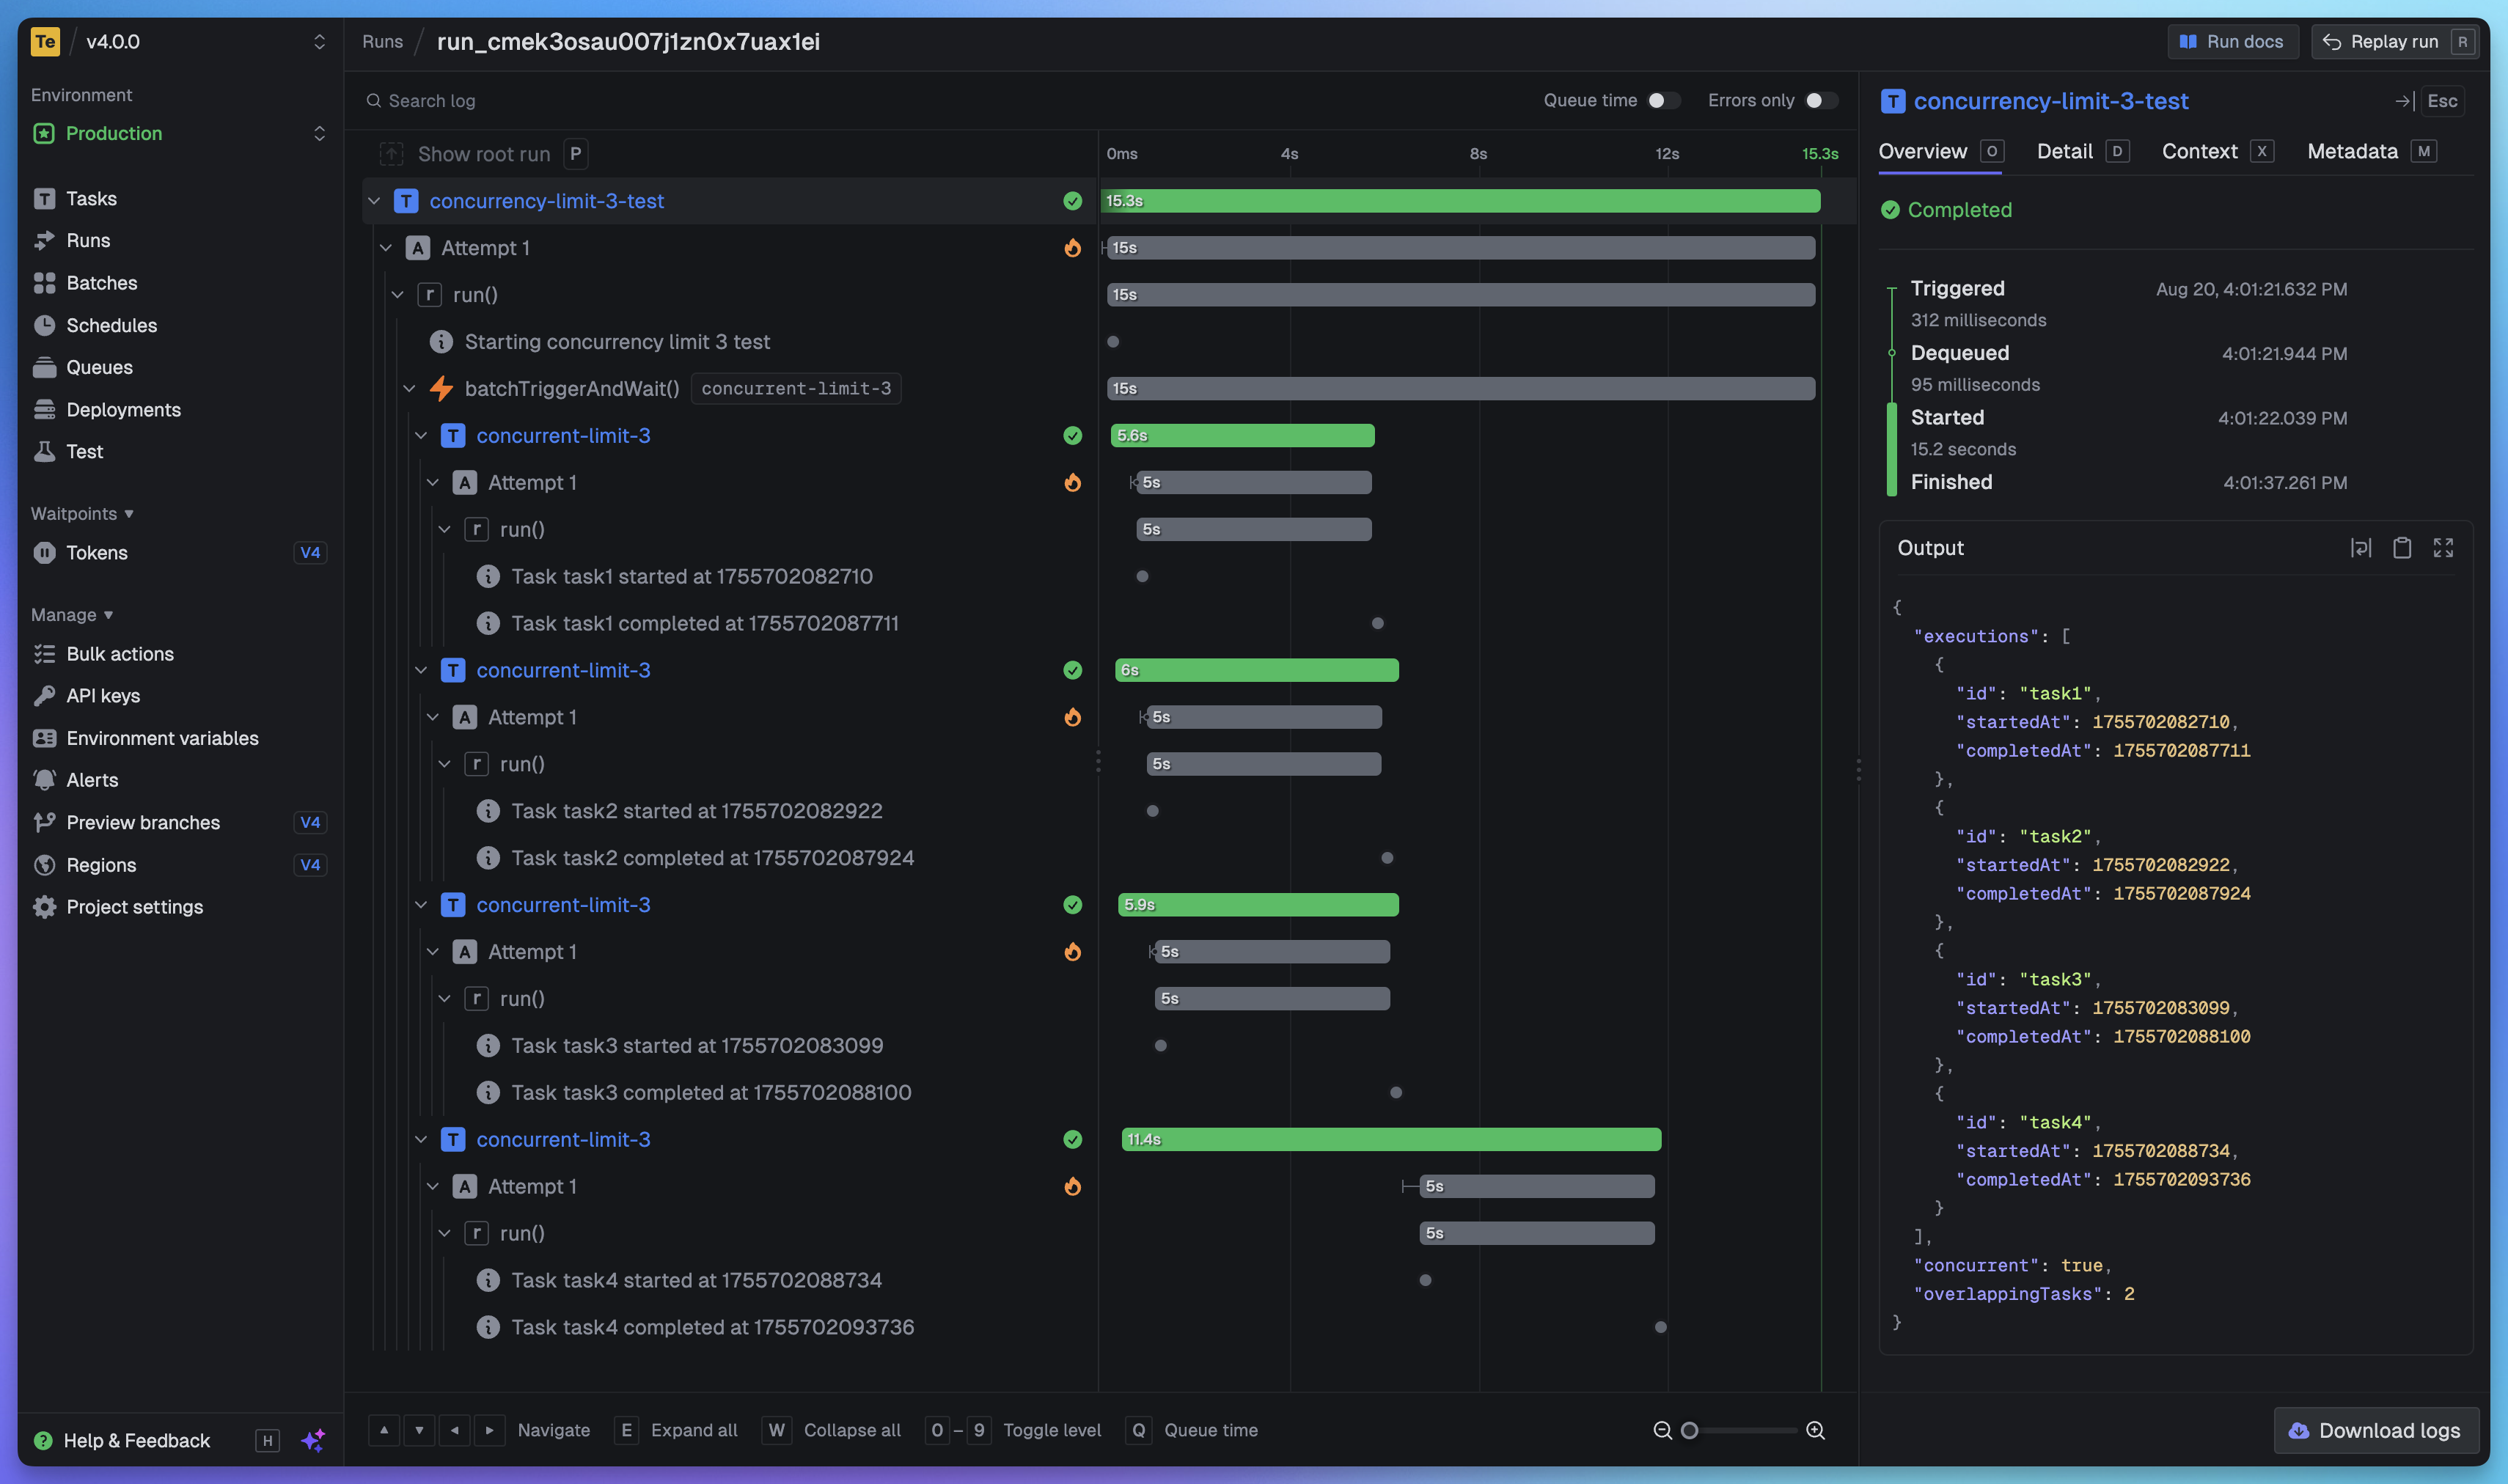
View every task in every run so you can tell exactly what happened. We provide a full trace view of every task run so you can see what happened at every step.
Getting started
The quickest way to get started is to create an account and project in our web app, and follow the instructions in the onboarding. Build and deploy your first task in minutes.
Useful links:
- Quick start - get up and running in minutes
- How it works - understand how Trigger.dev works under the hood
- Guides and examples - walk-through guides and code examples for popular frameworks and use cases
Self-hosting
If you prefer to self-host Trigger.dev, you can follow our self-hosting guides:
- Docker self-hosting guide - use Docker Compose to spin up a Trigger.dev instance
- Kubernetes self-hosting guide - use our official Helm chart to deploy Trigger.dev to your Kubernetes cluster
Support and community
We have a large active community in our official Discord server for support, including a dedicated channel for self-hosting.
Development
To setup and develop locally or contribute to the open source project, follow our development guide.