v4.5.11
7797 Commits
| Author | SHA1 | Message | Date | |
|---|---|---|---|---|
 github-actions[bot] github-actions[bot]
|
6685cbd599 |
chore: release v4.5.11 (#4557)
## Summary
4 new features, 24 improvements, 10 bug fixes.

## Highlights

- Allow `trigger deploy` to authenticate with an environment API key
from `TRIGGER_ACCESS_TOKEN`.
([#4561](https://github.com/triggerdotdev/trigger.dev/pull/4561))

## Improvements
- Chat in the browser now reconnects when the connection drops mid-turn,
instead of leaving the reply stuck as if it were still generating.
Reports can be fetched as structured data with the `json` format, and
the shortest report period is now one minute (`1m`, `30m`, `1h`, `7d`).
The `mint-token` command's help is clearer too: a token minted without
`--cap` is read-only, and `--ttl` shows the correct maximum lifetime of
7 days.
([#4418](https://github.com/triggerdotdev/trigger.dev/pull/4418))
- The dev environment onboarding now tracks real progress. After you run
`init`, the setup checklist marks your project as initialized, and it
updates live as your dev server connects and your tasks register. The
blank state also adds a "Copy AI agent prompt" button that copies a
ready-to-paste setup prompt (pre-filled with your project reference) for
Claude Code, Cursor, or any coding agent.
([#4563](https://github.com/triggerdotdev/trigger.dev/pull/4563))

The `init` scaffold now imports from `@trigger.dev/sdk` instead of the
deprecated `@trigger.dev/sdk/v3` subpath.
- Deployed images now ship dependencies and bundled task code as
separate layers. Repeat deploys with unchanged dependencies typically
push and pull far less data, making deploys and worker image pulls
faster.
([#4551](https://github.com/triggerdotdev/trigger.dev/pull/4551))
- The current-worker API now reports each task's queue, so you can see
which tasks write to a given queue.
([#4525](https://github.com/triggerdotdev/trigger.dev/pull/4525))
- Watch-mode chat streams now survive quiet windows and page reloads,
and a reply cut off by a lost connection shows an error instead of
appearing finished. Aborting a resumed subscription only closes your
local stream — call `stopGeneration(chatId)` or pass `stopOnAbort: true`
to stop the run. Also fixed a race where quickly restarting a stream
could break stop and reconnect, and stopping a chat now hands it back to
your other tabs instead of leaving them read-only.
([#4516](https://github.com/triggerdotdev/trigger.dev/pull/4516))

## Server changes

These changes affect the self-hosted Docker image and Trigger.dev Cloud:

- The dashboard agent now has a monthly message allowance and plan-based
limits on watches. Queries stay read-only with clearer errors when busy,
and messages with unusual characters no longer fail to send.
([#4516](https://github.com/triggerdotdev/trigger.dev/pull/4516))
- Meet the dashboard agent: a chat in every environment that answers
questions about your runs, queues, errors and health with real data and
links, replacing Ask AI everywhere it used to appear. Investigate a
failed run, an error, a backed-up queue or a run that hasn't started to
get a worked-through answer — what happened, why, and how to fix it,
with every claim linked to the runs, errors and deploys behind it. It
reads your data read-only, works on preview and dev branches with that
branch's own data, and reads the same everywhere — dashboard, terminal,
editor. A very long chat keeps working: the agent summarises the earlier
part and carries on.

**Watch…** on a run, queue, error or the health report tells you when
things change: a run finishes, a queue clears or grows past a number you
pick, an error comes back, an environment recovers. The answer arrives
in the chat and, if you want, by email, Slack or webhook — and the agent
can look into bad news on its own. A watch reaches you on any browser
you sign in from, without opening the chat first.

A sample of conversations is scored automatically so the agent keeps
getting better; only the score and a one-line summary are kept, never
your messages, data or code, and we can switch it off for your
organization on request. Ask the agent instead of the Docs buttons in
page headers — they stay there when the agent isn't available to you.
Separately, a queue's wait times, peak depth, throughput and throttling
can now be read from the API.
([#4418](https://github.com/triggerdotdev/trigger.dev/pull/4418))
- Add backend support for delaying cron schedules within a specified
window with a minimum of 60 seconds.
([#4566](https://github.com/triggerdotdev/trigger.dev/pull/4566))
- Reduced recurring background database load from the billing-limit
recovery check, so paused environments are reconciled with less
overhead.
([#4590](https://github.com/triggerdotdev/trigger.dev/pull/4590))
- Validating a schedule when deploying or updating a schedule now does
less work on projects with many preview branches, so those operations
stay fast as branches accumulate.
([#4598](https://github.com/triggerdotdev/trigger.dev/pull/4598))
- Project pages now load faster for projects with a large number of
preview branches, by no longer loading archived branch environments that
aren't shown.
([#4595](https://github.com/triggerdotdev/trigger.dev/pull/4595))
- Database queries that filter on a list of values now reuse cached
query plans more consistently, instead of forcing the database to
re-plan whenever the list length changes.
([#4480](https://github.com/triggerdotdev/trigger.dev/pull/4480))
- Routine cleanup of old dashboard agent data now runs on its own
schedule.
([#4599](https://github.com/triggerdotdev/trigger.dev/pull/4599))
- Database connection metrics are now reported for every configured
database connection instead of only the primary one, and stay accurate
regardless of connection type.
([#4541](https://github.com/triggerdotdev/trigger.dev/pull/4541))
- Deployment-related API endpoints now draw from their own generous rate
limit budget, configurable via the `DEPLOYMENT_RATE_LIMIT_*` environment
variables, so runtime API traffic no longer competes with deployments
for the same per-environment budget.
([#4565](https://github.com/triggerdotdev/trigger.dev/pull/4565))
- Deleting or editing a secret environment variable is now fast and no
longer slows down as a project accumulates variables.
([#4555](https://github.com/triggerdotdev/trigger.dev/pull/4555))
- Speed up personal access token lookups by indexing them on their owner
([#4588](https://github.com/triggerdotdev/trigger.dev/pull/4588))
- Switching project or organization in the sidebar now keeps you on the
same page instead of sending you back to Tasks. Pages for a specific
run, deploy or other single item open the matching list instead.
([#4585](https://github.com/triggerdotdev/trigger.dev/pull/4585))
- Reduced database load when loading the dashboard by removing an unused
organization member count that was being calculated on every page
navigation.
([#4587](https://github.com/triggerdotdev/trigger.dev/pull/4587))
- The environment variables page now loads a page at a time, keeping it
fast for projects with a large number of variables. Search matches
variable names across every page.
([#4597](https://github.com/triggerdotdev/trigger.dev/pull/4597))
- Groundwork for an alternative database connection driver, gated behind
configuration and disabled by default, so there is no change to default
behavior.
([#4539](https://github.com/triggerdotdev/trigger.dev/pull/4539))
- Deleting an alert channel is now fast and no longer slows down as a
project builds up alert history.
([#4554](https://github.com/triggerdotdev/trigger.dev/pull/4554))
- Reduced internal overhead on the API under high load.
([#4532](https://github.com/triggerdotdev/trigger.dev/pull/4532))
- Out-of-date upgrade prompts no longer appear in the dashboard: the
"V4" badges and the notices saying preview branches and the queues table
need V4 have been removed. The side menu still warns you when a project
is on v3, with updated wording and a link to the v4 upgrade guide.
([#4589](https://github.com/triggerdotdev/trigger.dev/pull/4589))
- Make background worker registration cheaper for projects with many
scheduled tasks by scoping declarative schedule reconciliation to the
current environment and dropping redundant schedule lookups.
([#4577](https://github.com/triggerdotdev/trigger.dev/pull/4577))
- Speed up setting and importing environment variables for projects with
many variables.
([#4579](https://github.com/triggerdotdev/trigger.dev/pull/4579))
- Loading the deployments list is now faster, especially when filtering
by deployment status on projects with many deployments.
([#4591](https://github.com/triggerdotdev/trigger.dev/pull/4591))
- Fixed the billing limits page timing out for organizations with many
preview branches, especially while a spend limit was being enforced. The
page now loads quickly, so you can raise or resolve your limit without
delay. ([#4594](https://github.com/triggerdotdev/trigger.dev/pull/4594))
- Fix the Concurrency page showing the plan's default concurrency for
the dev environment instead of the environment's actual limit.
([#4596](https://github.com/triggerdotdev/trigger.dev/pull/4596))
- Creating an organization sometimes left you back on the creation form
even though the organization had already been created, so clicking
Create again made a duplicate. Creating an organization now completes
and takes you to your new organization.
([#4530](https://github.com/triggerdotdev/trigger.dev/pull/4530))
- Ensure creating a project completes instead of returning to its
creation form after a navigation error.
([#4584](https://github.com/triggerdotdev/trigger.dev/pull/4584))
- Renaming a project now keeps you on the project settings page and
tells you what happened, instead of silently moving you to the tasks
page or clearing the form with no explanation.
([#4601](https://github.com/triggerdotdev/trigger.dev/pull/4601))
- Fixed support threads showing no account details for some customers,
so the team can see your plan, organizations and projects when you get
in touch.
([#4575](https://github.com/triggerdotdev/trigger.dev/pull/4575))
- In the light theme, the Format, Clear and Copy buttons on the query
editor no longer blend into the query text behind them.
([#4592](https://github.com/triggerdotdev/trigger.dev/pull/4592))
- The health report now says start latency is "unknown" when there is no
data for it, instead of showing a healthy-looking 0ms
([#4544](https://github.com/triggerdotdev/trigger.dev/pull/4544))
- Realtime streams written inside a chat session run now use the same
backend as the session itself, and runs are no longer created against a
backend that cannot serve them.
([#4564](https://github.com/triggerdotdev/trigger.dev/pull/4564))
- The grouped "watch updates" notification now shows the total number of
results waiting, instead of only the most recent batch's count.
([#4525](https://github.com/triggerdotdev/trigger.dev/pull/4525))

<details>
<summary>Raw changeset output</summary>

# Releases
## @trigger.dev/build@4.5.11

### Patch Changes

- Updated dependencies:
  - `@trigger.dev/core@4.5.11`
## trigger.dev@4.5.11

### Patch Changes

- Chat in the browser now reconnects when the connection drops mid-turn,
instead of leaving the reply stuck as if it were still generating.
Reports can be fetched as structured data with the `json` format, and
the shortest report period is now one minute (`1m`, `30m`, `1h`, `7d`).
The `mint-token` command's help is clearer too: a token minted without
`--cap` is read-only, and `--ttl` shows the correct maximum lifetime of
7 days.
([#4418](https://github.com/triggerdotdev/trigger.dev/pull/4418))
- Allow `trigger deploy` to authenticate with an environment API key
from `TRIGGER_ACCESS_TOKEN`.
([#4561](https://github.com/triggerdotdev/trigger.dev/pull/4561))
- The dev environment onboarding now tracks real progress. After you run
`init`, the setup checklist marks your project as initialized, and it
updates live as your dev server connects and your tasks register. The
blank state also adds a "Copy AI agent prompt" button that copies a
ready-to-paste setup prompt (pre-filled with your project reference) for
Claude Code, Cursor, or any coding agent.
([#4563](https://github.com/triggerdotdev/trigger.dev/pull/4563))

The `init` scaffold now imports from `@trigger.dev/sdk` instead of the
deprecated `@trigger.dev/sdk/v3` subpath.

- Deployed images now ship dependencies and bundled task code as
separate layers. Repeat deploys with unchanged dependencies typically
push and pull far less data, making deploys and worker image pulls
faster.
([#4551](https://github.com/triggerdotdev/trigger.dev/pull/4551))
- Updated dependencies:
  - `@trigger.dev/core@4.5.11`
  - `@trigger.dev/build@4.5.11`
  - `@trigger.dev/schema-to-json@4.5.11`
## @trigger.dev/core@4.5.11

### Patch Changes

- Chat in the browser now reconnects when the connection drops mid-turn,
instead of leaving the reply stuck as if it were still generating.
Reports can be fetched as structured data with the `json` format, and
the shortest report period is now one minute (`1m`, `30m`, `1h`, `7d`).
The `mint-token` command's help is clearer too: a token minted without
`--cap` is read-only, and `--ttl` shows the correct maximum lifetime of
7 days.
([#4418](https://github.com/triggerdotdev/trigger.dev/pull/4418))
- The current-worker API now reports each task's queue, so you can see
which tasks write to a given queue.
([#4525](https://github.com/triggerdotdev/trigger.dev/pull/4525))
## @trigger.dev/python@4.5.11

### Patch Changes

- Updated dependencies:
  - `@trigger.dev/core@4.5.11`
  - `@trigger.dev/sdk@4.5.11`
  - `@trigger.dev/build@4.5.11`
## @trigger.dev/react-hooks@4.5.11

### Patch Changes

- Updated dependencies:
  - `@trigger.dev/core@4.5.11`
## @trigger.dev/redis-worker@4.5.11

### Patch Changes

- Updated dependencies:
  - `@trigger.dev/core@4.5.11`
## @trigger.dev/rsc@4.5.11

### Patch Changes

- Updated dependencies:
  - `@trigger.dev/core@4.5.11`
## @trigger.dev/schema-to-json@4.5.11

### Patch Changes

- Updated dependencies:
  - `@trigger.dev/core@4.5.11`
## @trigger.dev/sdk@4.5.11

### Patch Changes

- Chat in the browser now reconnects when the connection drops mid-turn,
instead of leaving the reply stuck as if it were still generating.
Reports can be fetched as structured data with the `json` format, and
the shortest report period is now one minute (`1m`, `30m`, `1h`, `7d`).
The `mint-token` command's help is clearer too: a token minted without
`--cap` is read-only, and `--ttl` shows the correct maximum lifetime of
7 days.
([#4418](https://github.com/triggerdotdev/trigger.dev/pull/4418))
- Watch-mode chat streams now survive quiet windows and page reloads,
and a reply cut off by a lost connection shows an error instead of
appearing finished. Aborting a resumed subscription only closes your
local stream — call `stopGeneration(chatId)` or pass `stopOnAbort: true`
to stop the run. Also fixed a race where quickly restarting a stream
could break stop and reconnect, and stopping a chat now hands it back to
your other tabs instead of leaving them read-only.
([#4516](https://github.com/triggerdotdev/trigger.dev/pull/4516))
- Updated dependencies:
  - `@trigger.dev/core@4.5.11`

</details>

Co-authored-by: github-actions[bot] <41898282+github-actions[bot]@users.noreply.github.com>
helm-v4.5.11 v.docker.4.5.11 v4.5.11 |
||
|
Matt Aitken
|
6485f37bf2 |
fix(webapp): show the dev environment's actual limit in the concurrency page Total column (#4596)
## Summary On the Concurrency page, the dev environment row's Total always showed the plan's included dev concurrency, even when the environment's limit had been raised. The row's own "Extra concurrency" value was already derived from the real limit, so the two columns could disagree with each other. ## Root cause The Total cell renders `planConcurrencyLimit + allocation`, where `allocation` is the state behind the editable prod/staging inputs. Dev environments are deliberately excluded from that allocation map (dev concurrency is not purchasable), so the dev row's allocation always resolved to 0 and the Total fell back to the plan value. The dev row now renders the environment's actual `maximumConcurrencyLimit` instead. |
||
|
Katia Bulatova
|
d1ac3d597d |
fix(webapp): org avatars blocked by img-src CSP and avatar overflow on failed load (#4600)
## What & why Org avatars disappeared from the sidebar, replaced by alt text spilling across it. Two bugs stacked: the document img-src CSP pins the Google favicon endpoint org avatars are stored as, but Google 302-redirects it to `tN.gstatic.com` and CSP re-checks the redirect target, so the avatar is refused. Changelog images served from `trigger.dev` in the agent chat were also missing from the allowlist. And `Avatar.tsx` had no clipping and no error fallback, so a refused image degraded into overflowing alt text. ## What's inside **CSP allowlist** — `app/utils/cspImageOrigins.ts`: the base sources gain the four gstatic shards `t0`–`t3.gstatic.com`, path-pinned to `/faviconV2`, plus `https://trigger.dev/changelog/` as a path prefix. No wildcards — the no-wildcard beacon policy stands. The shard hosts are Google-operated with no public write path, so the enumeration is as narrow as the existing `s2/favicons` entry; if Google ever adds a `t4`, the failure mode is one broken avatar, not a broken page. **Avatar fallback** — `app/components/primitives/Avatar.tsx`: the image box clips, and a failed load falls back to the globe icon. That covers failures before hydration too — `onError` never replays for a node that already failed, so a ref checks `complete && naturalWidth === 0` at attach time. The error state resets when the URL changes (`key={avatar.url}`). **Radio card theming** — `app/components/primitives/RadioButton.tsx`: in the dark themes the checked radio card rendered darker than the unchecked ones. Unchecked cards now sit on `background-bright` (near-black in dark, unchanged white in light) and the checked card uses the `surface-control` tokens, so selection reads black → grey in dark themes; light theme keeps its current look. The API keys route keeps its indigo checked-hover via an explicit override. ## Testing The CSP test helper now implements CSP's real path-matching rule (trailing slash = prefix, otherwise exact, query ignored) and asserts the pins hold: the gstatic redirect target passes, `beacon.png` on gstatic, a `t9` shard, and non-changelog `trigger.dev` paths stay blocked. 39 tests green plus webapp typecheck. Verified against a running webapp that the served directive contains the new sources. |
||
|
James Ritchie
|
0b52af94fa |
feat(webapp): restyle the modal and sheet close buttons (#4603)
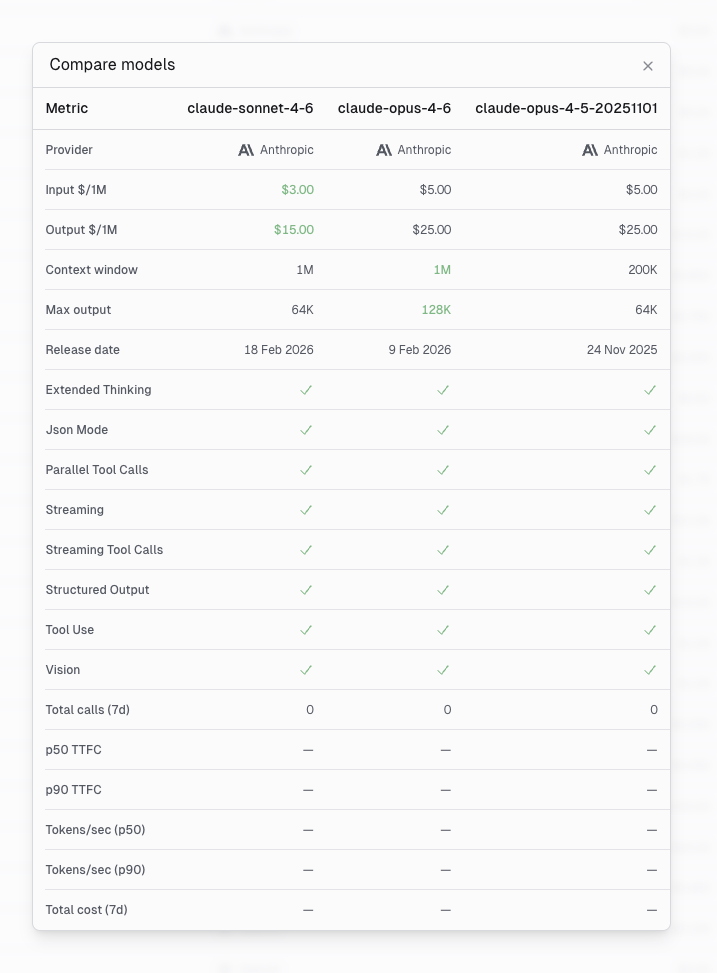
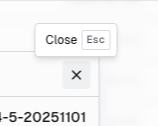
The close button on modals and slide-over panels is now a simpler icon-only button. The `Esc` key label moves out of the button and into a hover tooltip, delayed by 500ms. <img src="https://raw.githubusercontent.com/triggerdotdev/trigger.dev/31b781afb984e1ca36b31cd1e7d3a475f06310d1/modal-close-button.png" width="620" alt="Modal with the new square close button in the top right" /> <img src="https://raw.githubusercontent.com/triggerdotdev/trigger.dev/31b781afb984e1ca36b31cd1e7d3a475f06310d1/modal-close-button-tooltip.png" width="200" alt="Hovering the close button shows a Close tooltip with the Esc key" /> ### Verified Both surfaces, driven in a real browser: no tooltip on open despite autofocus, hidden at 300ms of hover, "Close · Esc" at 700ms, hides on pointer leave, `Escape` closes, clicking the X closes with no orphaned tooltip, and the button stays keyboard-focusable (`tabIndex 0`). The `fullscreen` dialog variant flips the tooltip below to stay on-screen. `typecheck --filter webapp` passes; `format` and `lint` are clean. 🤖 Generated with [Claude Code](https://claude.com/claude-code) <!-- conductor-workspace-link --> --- [Open workspace in Conductor](https://app.conductor.build/workspace/a7368189-9fbb-4edd-891c-43c633931bcf) Co-authored-by: Claude Opus 5 (1M context) <noreply@anthropic.com> |
||
|
claude[bot]
|
f6f3b75547 | chore: remove obsolete v3/v4 version copy from the dashboard (#4589) | ||
|
claude[bot]
|
802d23836d | fix(webapp): show the toast when saving project general settings (#4601) | ||
|
Katia Bulatova
|
ee854480fe |
fix(webapp): dashboard agent maintenance moves into the agent project (#4599)
## What & why The dashboard agent's upkeep — retention deletes and the investigation sweep — ran as cron jobs on the webapp's common worker, even though it only touches the agent's own datastore. This moves that upkeep into the agent's Trigger project as scheduled tasks (TRI-13182). ## What's inside **Retention** — `internal-packages/dashboard-agent/src/maintenance.ts`, a daily task (03:00 UTC). Deletes turn evals older than 30 days, hard-deletes chats soft-deleted more than 30 days ago, and purges terminal watches and submission rows older than 7 days. It used to run every 5 minutes; nothing needs a hard delete that fast, so it is daily now, draining in bounded batches and warning if it hits the cap. It retries (3 attempts) because the next run is a day away. It connects with `DASHBOARD_AGENT_DATABASE_URL`, falling back to `DATABASE_URL` like every other task in the package (the deletes are confined to the agent's own Postgres schema), and skips when neither is set. **Investigation sweep** — `src/investigation-sweep.ts`, every 5 minutes, same as before: settles investigation cards stuck `in_progress` (30-minute window, attempt cap, force-abandon note). It keeps the fast cadence because it fixes live state the UI is showing. **What stays in the webapp.** The watch finalize/deliver sweep and batch rearm: they cover a dead agent-side tick chain — a backstop can't live inside the thing it backstops — and they need the main database and the alerts worker. The org-deletion chat purge also stays: deletion must not depend on the agent project being deployed. The removed cron job keeps a cron-less tombstone entry so already-queued items drain cleanly; remove it in a follow-up. **Test plumbing** — the drizzle migration replayer that webapp tests hand-rolled is now exported once from `@internal/dashboard-agent-db/testing`; the moved tests live in the agent package as `src/*.test.ts` against real Postgres. ## Testing Agent package: retention passes (backlog drain, batch cap, no-op guard, chat-delete cascade) and the sweep, on testcontainers Postgres. Webapp: the watch/chat suites, plus a test that a settlement card stops the dashboard spinner. Full typecheck on both. |
||
|
Saadi Myftija
|
45444a7b1d |
feat: publish deploy base images to DockerHub (#4581)
Publishes the base images deployed task containers will build on:
`triggerdotdev/node:{21,22,24,26}-bookworm` and
`triggerdotdev/bun:1.3-node20-bookworm`, each with a `-build` toolchain
variant, multi-arch, built from a pinned Debian snapshot so every
published layer is reproducible from recorded inputs and carries a
GitHub provenance attestation.

Publishing runs on manual dispatch and on merges touching
`base-images/`. Pull requests build without pushing.
|
||
|
Eric Allam
|
aca234d1c3 |
perf(webapp): bound checkSchedule environment load to the requested ids (#4598)
## What

`CheckScheduleService.call` loaded **every** environment of a project
(`{ id, type, archivedAt }`, no filter) and then immediately narrowed to
just the requested `environmentIds` via
`resolveProjectScopedEnvironments`. It only ever uses the requested envs
(to reject foreign env ids and reject archived branches). On a
preview-heavy project that meant loading hundreds of archived branch
rows to validate one, on a path called in a per-scheduled-task loop on
the deploy path (`createBackgroundWorker` -> `syncDeclarativeSchedules`)
and from `upsertTaskSchedule`.

The query is index-backed and individually fast (rows_read/returned = 1
per predicate), so this is about result-set width / egress and wasted
work at scale (~580k calls/24h observed via Insights), not a slow plan.

## Change

Bound the `environments` relation load to `boundedIn(environmentIds)`:

```ts
environments: {
  where: { id: { in: boundedIn(environmentIds) } },
  select: { id: true, type: true, archivedAt: true },
}
```

Returns `<=` the number of requested envs (usually 1) instead of the
whole project. Both existing behaviors are preserved:

- **Foreign-id rejection**: the relation is still scoped to the project,
so a requested id belonging to another project never comes back and
`resolveProjectScopedEnvironments` reports it as `foreign` (a missing
requested id is already treated as foreign).
- **Archived-branch rejection**: a requested id that is an archived
branch still comes back with `archivedAt` set, so the downstream `Can't
add or edit a schedule for an archived branch` check still fires.

`archivedAt` is kept in the select deliberately, so this bounds by id
rather than filtering archived rows out.

## Evidence (isolated stack, seeded 1 prod env + 40 archived branch
envs)

Local `EXPLAIN (ANALYZE)` of the exact environments sub-select:

| | rows returned | buffers |
|---|---|---|
| before (unbounded) | **41** | shared hit=12 |
| after (`id IN (requested)`) | **1** (`Rows Removed by Filter: 40`) |
shared hit=4 |

Same `RuntimeEnvironment_projectId_idx`, no plan change. Rows to the
client drop to `len(environmentIds)`, which is the point.

**Unit (vitest, testcontainers, real Postgres):**
`apps/webapp/test/checkSchedule.test.ts` extended to prove, on real
rows, that the bounded load returns only the requested env (1 of 10),
still reports a foreign id as foreign, and still surfaces an archived
branch when it is the requested one. 5/5 pass.

**Full e2e (both execution modes, real stack):** a purpose-built project
with two declarative `schedules.task`s.
- `trigger dev`: dev worker created, both schedules synced through the
edited `checkSchedule` loop, no errors.
- `trigger deploy` (managed deployment): PRODUCTION worker registered,
both schedules synced against the **prod** environment through the same
loop, prod + dev schedule instances active, no errors.

`typecheck --filter webapp` clean.

## Rollout / rollback

Straight deploy, no flag, no migration. Rollback is revert-only
(read-path narrowing, no data change). Old and in-flight rows read
correctly under both the old and new code.

## Out of scope

The two lower-priority sibling reads in the ticket (the Query/metrics
env id->slug map and the env-var repository fan-out) are left for
follow-ups; they need caching / per-method scoping rather than this
single bound.
|
||
|
Eric Allam
|
c6ef5f3959 |
perf(webapp): paginate the environment variables settings page (#4597)
## What

The environment variables settings page loaded **every** variable in the
project in one shot, with a nested `values` read plus a `valueReference`
(SecretReference) sub-load that was selected but never read. For a
project with many variables this pulled `variables × environments` value
rows (~18k for large projects) on every page load, plus a matching
~18k-row `SecretReference IN` query.

This paginates the presenter by variable key and removes the dead
include.

- Remove the never-read `valueReference: { select: { key } }` include →
the `SecretReference` query is gone entirely.
- Paginate the parent variable query: `count` + `orderBy key` +
`skip/take`, page size 50 → the value read is bounded to `pageSize ×
environments` per page.
- Scope the count and the page to variables that have a value in a
displayed environment (`values: { some: { environmentId: { in } } }`),
so `totalCount`/`totalPages` and the `skip/take` window match what
actually renders (no phantom empty pages from variables that live only
in archived branches or another member's dev env).
- Display order comes from the DB `orderBy: { key: "asc" }` — the
presenter no longer re-sorts each page with `localeCompare`, which under
pagination could disagree with the DB collation at page boundaries.
- The secret-value lookup (`SecretStore` keys) and the updater lookup
(`user` by id) are now scoped to the current page instead of the whole
project.
- Search moves server-side (variable key, case-insensitive) and drives
both the count and the page; the UI gains standard pagination controls.

## Why

The two correlated ~18k-row control-plane queries flagged in the ticket
come from this settings-page presenter, not from any hot path. Both are
index-covered (`rows_read == rows_returned`); the issue is the sheer
volume fetched in one burst. Bounding it per page removes the burst.

## Evidence

Measured on an isolated stack with a seeded project of 1000 variables ×
3 environments (3000 value rows), using Prisma's emitted-SQL log:

| | SecretReference query | value rows fetched |
| --- | --- | --- |
| before | 1 | 3000 |
| after | **0** | **150** (page 1) + one `count` |

`EXPLAIN` on Prisma's verbatim statements (index confirmed via
`enable_seqscan=off`; the local table is too small for the planner to
choose them by default):

- `count` (`WHERE projectId AND EXISTS(values in displayed envs)`) →
Hash Join: Index Scan on `EnvironmentVariable_pkey` + Bitmap Index Scan
on `EnvironmentVariableValue_environmentId_idx`
- paginated parent (`WHERE projectId AND EXISTS(...) ORDER BY key
LIMIT/OFFSET`) → Nested Loop Semi Join: Index Scan on
`EnvironmentVariable_projectId_key_key` (**no Sort node**) driving an
Index-Only Scan on
`EnvironmentVariableValue_variableId_environmentId_key`
- nested values (`variableId = ANY … AND environmentId = ANY …`) → index
scan on `EnvironmentVariableValue_environmentId_idx`
- `SecretStore` keys (`key = ANY …`) → index scan on
`SecretStore_key_idx`

No new index required. Verified in the browser on the seeded project: 20
pages, page navigation, server-side search (matches across all pages),
last page renders, no app console errors. `typecheck`, `oxlint`, `oxfmt`
all clean.

## Behavior change

The previous client-side search matched variable **name and value** (and
environment type / branch name). Values are encrypted at rest and
resolved separately, so they cannot be searched server-side under
pagination. Search is now **variable-name only**, server-side,
case-insensitive. Projects with fewer than one page of variables see no
pagination bar and no visible change.

## Rollout / rollback

Pure read-path change on a dashboard loader, no schema or data
migration. Rollback is a straight revert.

## Screenshots

<img width="2400" height="1794" alt="01-page1"
src="https://github.com/user-attachments/assets/d4a7effd-d167-4dd6-92f4-6e9174818acd"
/>
<img width="2400" height="1794" alt="02-search-single"
src="https://github.com/user-attachments/assets/cd113ca9-ff87-431f-b2f6-7f7d36f2b32a"
/>
|
||
|
Eric Allam
|
8d0f693186 |
perf(webapp): drop archived branch environments from project env loads (#4595)
## What

Several project pages loaded **every** `RuntimeEnvironment` row for a
project, including the archived preview-branch environments that are
never shown in the UI. On a project with heavy preview-branch usage that
means thousands of rows per load, producing a large result set and a
rare multi-second tail on the environment lookup (~30s outlier observed
via Insights on `RuntimeEnvironment` projectId lookups, fingerprint
`f2b3ecab…`).

The tail is dominated by the size of the result being
parsed/transferred, not by the query plan (it already used
`RuntimeEnvironment_projectId_idx` with no over-read). So the fix is to
stop returning archived branch environments.

## Diagnosis correction

The ticket framed this as a "large `projectId IN` list" and suggested
bounding the IN list / cursor pagination. It's actually a Prisma
**nested relation load** on a *single-project* `project.findFirst`, so
the `IN (...)` holds one projectId and the trailing `OFFSET $1` is
Prisma's relation-subquery artifact. The 4,644 rows in the observed
execution were **one project with ~4,644 environments** (accumulated
archived branches), not many projects.

## Change

Filter the `environments` relation load to `archivedAt: null` (base envs
never archive, so only archived preview branches are excluded):

- `ProjectPresenter.server.ts`
-
`orgs.$organizationSlug.projects.$projectParam.{concurrency,apikeys,environment-variables,settings}.ts`
(best-env resolvers)

And remove an **unused** `environments` select from
`DeploymentListPresenter.server.ts` (it was selected but never read).

`loadProjectEnvironments` (replay route) already filters `archivedAt:
null` + env type; this change follows that existing precedent.

## Evidence (isolated stack, seeded one project with 2,000 archived
branch envs + 4 active)

`EXPLAIN (ANALYZE)` of the exact presenter sub-select:

| | rows returned | index |
|---|---|---|
| before (unfiltered) | **2004** | `RuntimeEnvironment_projectId_idx` |
| after (`archivedAt IS NULL`) | **4** (`Rows Removed by Filter: 2000`)
| same index, no plan change |

500x fewer rows to the client, which is what removes the parse-on-load
tail. No new index needed. `typecheck --filter webapp` clean. UI
verified: project layout, Deploys page, and the concurrency best-env
redirect all render with the 2,000 archived branches present in the DB
and zero console errors.

## Rollout / rollback

Straight deploy, no migration. Rollback is revert-only (read-path
filter, no data change). Old and in-flight rows read correctly under
both the old and new code.

## Limitation

A project with thousands of *active* branches would still load them all;
in practice active branches are few (branches are archived when their
work merges). Hard-bounding active branches would be a larger change and
is out of scope here.
|
||
|
Matt Aitken
|
bc3a33be24 |
fix(webapp): stop the billing limits page timing out under enforcement (#4594)
## Summary Opening the billing limits page while a spend limit was being enforced could time out with no response for organizations with many preview branches. That is exactly the moment the page matters: it is the only self-serve way to raise or resolve the limit. The page now loads fast regardless of how many environments the organization has. ## Root cause and fix The loader's queued-run count ran one ClickHouse count per billable environment, sequentially, with no timeout, and the environment list included every archived preview branch ever created. Thousands of environments times one round trip each held the response open past the edge timeout. The count is now a single org-level ClickHouse query filtered on environment type, capped server-side with max_execution_time. If the count fails, the loader falls back to 0 (the page hides the count label at 0) instead of throwing, so the recovery panel stays reachable even when the count errors. The billing-limit bulk-cancel path also stops enumerating archived environments. |
||
|
Katia Bulatova
|
622fa79643 |
fix(webapp): restore header docs buttons when the dashboard agent is unavailable (#4592)
Restores the page-header docs buttons removed in #4529 / #4418, shown only when the dashboard agent is unavailable (feature flag off, or pages outside the environment layout). The buttons are restored verbatim at their original spots — 22 sites across 21 files — wrapped in a small `WhenAgentUnavailable` gate that reads the agent context (SSR-safe, no hydration flicker). Also: in the light theme, the query editor's Format/Clear/Copy toolbar gets a translucent white background (`light:bg-white/80`) instead of transparent, so it no longer blends into the code behind it. <img width="1215" height="133" alt="Screenshot 2026-08-12 at 17 26 02" src="https://github.com/user-attachments/assets/4bdba825-9cbd-4df4-b6ca-0ea6691a534b" /> |
||
|
claude[bot]
|
442702e879 |
feat(webapp): stay on the same page when switching project or organization (#4585)
<!-- ccr-slack-attribution --> _Requested by **Eric Allam** · [Slack thread](https://triggerdotdev.slack.com/archives/C0BEM9Z73TM/p1786528784863449)_ **Before:** you're on the API keys page in project X, you switch to project Y in the sidebar, and you land on project Y's Tasks page. Same for switching organization. Every switch threw away the page you were looking at. **After:** you land on project Y's API keys page. Switching organization does the same thing, one project down. Pages that name a single thing — a run, a batch, a queue, a schedule, a deploy, a session, an error group — can't exist in another project, so those take you to the matching list page instead (a run page takes you to Runs). The environment is still chosen exactly as it is today: nothing tries to guess it in the browser. --- ## Testing - New `apps/webapp/app/utils/pageSwitching.test.ts` (35 tests). It reads the compiled Remix route manifest, so the portable-page list can't silently drift from the routes: - every environment page that names no resource survives an environment switch — the same pages the old slug swap kept - the two branch lists are the only pages an environment switch keeps and a project switch drops - the pages gated per organization — Logs, Query and the queue metrics dashboard — travel with an environment or project switch but not an organization switch, and that list is derived from the route sources so a new gated page cannot be missed - every portable page points at a route that exists - every one of the 19 environment routes that takes a resource id truncates to a list page, with the id gone - portable pages resolve to themselves, so switching twice lands in the same place - every rejection case: leading slash, `//`, absolute URL, `..`, percent-encoded traversal, `javascript:`, unknown page — each falls back to Tasks rather than being sanitised into something - Manual: switch project and organization from API keys, project settings, a run page, and a queue page. - `pnpm run typecheck --filter webapp` passes. - The rest of the webapp suite needs Docker for testcontainers, which wasn't available here; all colocated pure unit tests under `app/utils/` pass (15 files, 150 tests). --- ## Changelog Switching project or organization in the sidebar keeps you on the same page instead of sending you back to Tasks. Pages for a specific run, deploy or other single item open the matching list instead. --- ## How The switcher links already pointed at `/orgs/:org/projects/:project` and `/orgs/:org`, whose `_index` loaders resolve the best environment (and, for the organization, the best project) and redirect. So the page travels as a search param on those links, and each loader appends it to the path it already builds: - `app/utils/pageSwitching.ts` — one pure module. `environmentPortablePage(suffix)` and `projectPortablePage(suffix)` walk up the suffix until they find an entry in an allowlist of portable pages, and answer with the environment root if they find none. The result is therefore always a literal from that closed set, which is what makes it safe to concatenate into a redirect target; there is no regex sanitising. The allowlist is built from the landing pages already listed in `deeplinkPages.ts` plus the handful of nested pages that file doesn't know about, so this isn't a new URL-shape table. - `app/hooks/useEnvironmentSwitcher.ts` — `usePageSwitcher()` derives the current page by slicing the environment layout route match's pathname off the current pathname, so there's no route table on the client either. The query string and hash are dropped on a project or organization switch, since filters encode task slugs and ids scoped to the project you're leaving. - Both `_index` loaders re-validate the page through the same function before using it. Two things worth a look: - **The environment switcher's truncation gap is fixed as a side effect.** It had a hand-written switch covering `runs/:runParam`, `deployments/:deploymentParam` and `schedules/:scheduleParam`; the other 16 id-bearing routes carried their id straight into the new environment (e.g. `queues/:queueParam`, `batches/:batchParam`, `errors/:fingerprint`, `sessions/:sessionParam`). All three switchers now share one truncation, and the test asserts it covers every such route in the manifest. - **Portability turned out to be two properties, not one.** Preview branches and dev branches render under any environment slug of their project — both loaders pass a hardcoded environment type and the project slug and never read `envParam` — so an environment switch keeps them, exactly as swapping the slug did before. A project or organization switch still falls back to Tasks, since the project you land in may have no preview branches. A test locks the environment half: every id-free page below an environment has to survive an environment switch. --- ## Screenshots _n/a — no visual change; only where the switcher links point._ 💯 --------- Co-authored-by: Claude <noreply@anthropic.com> |
||
|
Iss
|
4b4f6f2071 |
fix(webapp): accept Plain customers without an external id on customer cards (#4575)
Plain sends `customer.externalId` as an explicit `null` rather than
omitting the key. The schema validated it with `z.string().optional()`,
which accepts `undefined` but rejects `null`, so every customer we don't
set an `externalId` for got a 400 instead of a card — while the rest
worked, which made it look intermittent.

`email`, `externalId` and `thread` are now `nullish`. One of
email/externalId is still required, and the route's existing email
fallback resolves these customers.

Three related fixes in the same path:

- The route returned `{ cards: [] }` when no user matched. Plain records
an integration error for any requested key it doesn't get back, so that
surfaced as a broken card rather than a hidden one. Every requested key
is now answered, with `components: null` where there's no data.
- The impersonation link is offered only when the customer matched on
`externalId` — a value we set ourselves. An email match is a weaker
claim, since the address on a Plain customer isn't verified and for
customers created outside our own writes it comes from whoever sent the
message. Email-matched customers get the account rows without a
one-click impersonation link.
- The not-found log recorded raw customer identifiers; it now keeps
presence flags only.

The schema and the response helper moved to
`app/utils/plainCustomerCards.ts` so they can be unit-tested without
pulling in the db and env modules.

## Testing

`app/utils/plainCustomerCards.test.ts` — 11 tests covering the null
shapes, the every-key-answered response, and the missing-vs-zero
distinction. Verified locally.

Split out of #4571, which bundled this with an unrelated impersonation
fix.
|
||
|
Eric Allam
|
96b2959107 |
perf(database): index PersonalAccessToken.userId so token lookups stop seq-scanning (#4588)
## Summary The two personal-access-token lookups by `userId` (one also filtering `revokedAt is null`, the other also filtering `name`) had no index on `userId`, so each did a full sequential scan of the `PersonalAccessToken` table to return a single row. `userId` is also an unindexed foreign key. ## Fix Add a single `@@index([userId])`. A user owns only a handful of PATs, so once `userId` is indexed each lookup touches a few rows and the residual `revokedAt` / `name` filter is trivial. Both query shapes lead with `userId =`, so one index serves both and a composite would only add write cost. The migration uses `CREATE INDEX CONCURRENTLY IF NOT EXISTS`, which is online-safe under write load and reversible by dropping the index. Verified with a seeded local EXPLAIN: both queries go from a full sequential scan to an index scan on the new index. |
||
|
Eric Allam
|
db0ca9eb40 |
fix(webapp): drop unused OrgMember _count aggregate from org-list presenter (#4587)
## What `OrganizationsPresenter.#getOrganizations` selected a Prisma `_count.members` relation on every org-list load (hit on nearly every dashboard navigation). Prisma lowers that relation `_count` to a whole-`OrgMember`-table `GROUP BY organizationId` aggregate joined onto `Organization`. The computed `membersCount` field is read by **nothing** in the webapp, so the entire aggregate scan is wasted work. This removes the `_count` select and the `membersCount` field. The query keeps only the indexed `EXISTS` membership filter and the org/project selects. ## Why it's safe - `membersCount` has zero consumers (whole-webapp grep finds the name only at the point of assignment). It was added in #1796 (2023) and has been unused since. - The member count shown on the org settings/team page comes from a separate presenter query, not this one. No user-visible change. ## Evidence (generated SQL, before/after, seeded isolated stack) Before (with `_count.members`): ```sql SELECT ..., COALESCE(aggr._aggr_count_members, 0) FROM "Organization" LEFT JOIN (SELECT "organizationId", COUNT(*) AS _aggr_count_members FROM "OrgMember" GROUP BY "organizationId") aggr ON ... WHERE EXISTS (... "userId" = $1 ...) AND "deletedAt" IS NULL ORDER BY "createdAt" DESC ``` After: ```sql SELECT id, slug, title, avatar, "featureFlags" FROM "Organization" WHERE EXISTS (... "userId" = $1 ...) AND "deletedAt" IS NULL ORDER BY "createdAt" DESC ``` The whole-table `GROUP BY` aggregate is gone. The only remaining `OrgMember` access is the `EXISTS` on the caller's own membership (indexed by `userId`, a handful of rows). This is the single largest read-amplification query on the control-plane database (~1.39B rows read/day, ~719s DB CPU/day per Insights); removing it takes that portion to zero. Webapp typecheck passes. ## Rollout Straight deploy, zero blast radius. Rollback is a plain revert, no data migration. refs TRI-13170 |
||
|
Eric Allam
|
4fd7cc0f55 |
perf(webapp,database): index RuntimeEnvironment.pauseSource for the billing-limit reconcile tick (#4590)
## What

The `billingLimit.reconcileTick` worker calls
`getOrgIdsWithBillingPauseSource()` on
`BILLING_LIMIT_RECONCILE_INTERVAL_MS` (~every 90s) to find which orgs
currently have billing-limit-paused environments. Two problems:

1. `RuntimeEnvironment.pauseSource` had no index, so `WHERE pauseSource
= 'BILLING_LIMIT'` was a **sequential scan of the whole table** on the
control-plane primary, every tick.
2. Prisma `distinct` dedups **after** fetching, so it read every paused
row (thousands) to produce a handful of distinct org ids.

This PR:

- Adds a **partial index** on `RuntimeEnvironment (pauseSource,
organizationId) WHERE pauseSource IS NOT NULL`. Nearly all rows have
`pauseSource = null`, so the index stays tiny. Second column lets the DB
satisfy the distinct-org lookup from the index. Defined in SQL (Prisma
can't express partial indexes), matching the existing partial-unique
indexes on this model.
- Switches the query from `findMany({ distinct })` to
`groupBy(["organizationId"])`, pushing DISTINCT into the DB so it
returns only the distinct orgs.

## Evidence

**Correctness** — colocated `postgresTest` (testcontainers, no mocks):
multiple `BILLING_LIMIT` envs in one org collapse to one org id,
`pauseSource = null` envs are excluded, each org id returned once. 5/5
tests in `billingLimitReconciliation.test.ts` pass.

**Plan change** — `EXPLAIN ANALYZE` on a synthetic table (200k rows,
5,250 `BILLING_LIMIT` across ~40 orgs, mirroring the test-side numbers
from the investigation):

| | Before (no index) | After (partial index) |
|---|---|---|
| Plan | Seq Scan (194,750 rows removed by filter) | Bitmap Index Scan
on partial index |
| Buffers | 1355 | 51 (index 6 + heap 45) |
| Exec time | 6.06 ms | 0.59 ms |

Index size 56 kB vs table 11 MB. The key win: cost now scales with the
paused-env count, not total table size, which matters most on prod where
the table is far larger.

## Rollout & rollback

- **Index**: `CREATE INDEX CONCURRENTLY IF NOT EXISTS`, in its own
migration file. Pre-apply the index manually on the control-plane
primary before deploying the migration (the migration is a no-op if the
index already exists).
- **Query change** is behavior-equivalent (same distinct org set), so no
flag needed.
- **Rollback**: revert the deploy and drop the index. No data migration
either direction.

## Notes / limitations

- The planner uses a Bitmap Heap Scan, so `organizationId` is still read
from the heap (45 blocks for the matched rows only, not the whole
table). A pure index-only scan isn't chosen for the bitmap path; the
second index column keeps that open for the index-scan path at
negligible cost.

refs TRI-13169
|
||
|
Eric Allam
|
4658cd0721 |
perf(database): index WorkerDeployment on (environmentId, status, id) for the deployments list (#4591)
## What Adds a composite index `@@index([environmentId, status, id])` to `WorkerDeployment`. The public deployments list (`GET /api/v1/deployments`) filters by `status` and paginates by `id` descending. The existing indexes cover `(environmentId, createdAt)` and the PK, but nothing covers `status`. So for a status filter Postgres walks back through the environment's deployments discarding non-matching statuses, reading roughly 350 rows for every 1 returned (p99 ~1.1s on the busiest environments). The new index makes the status filter index-satisfied and lets `id` serve both the cursor range and the `ORDER BY id DESC`, bounding the read to a single page. Full composite (not partial) because callers filter by arbitrary status values with no single dominant one. ## Query ```sql SELECT ... FROM "WorkerDeployment" WHERE "environmentId" = $1 AND "status" = $2 [AND "id" < $3] ORDER BY "id" DESC LIMIT $4; ``` Source: `apps/webapp/app/routes/api.v1.deployments.ts`. ## Evidence Reproduced on an isolated stack: one environment seeded with 7,000 deployments, the filtered status appearing 1 in 333 rows. Before (no index): ``` Seq Scan on "WorkerDeployment" (rows=21) Rows Removed by Filter: 6979 Buffers: shared hit=206 Execution Time: 2.9 ms (+ a sort for id desc) ``` After (with the index): ``` Index Scan Backward using "WorkerDeployment_environmentId_status_id_idx" Index Cond: (environmentId = $1 AND status = $2) Buffers: shared hit=23 Execution Time: 0.43 ms ``` Rows-removed-by-filter drops to 0; buffers 206 -> 23. The cursor (mid-pagination) variant uses the same index with all three predicates as the index condition. A dense/common status keeps the cheap PK backward scan (already fine); the index targets exactly the rare-status paths that were amplified. End-to-end against the running webapp API: `?status=FAILED` returns the correct newest-first page and paginates correctly across pages, and the emitted SQL matches the query above. ## Rollout - Index only, `CREATE INDEX CONCURRENTLY IF NOT EXISTS` in its own migration file. Online-safe under write load. - Pre-apply the index in production before the migration deploys, per repo convention (the migration is then a no-op). - Rollback: drop the index. No data migration. refs TRI-13171 |
||
|
Chris Arderne
|
7b7d48916d | fix(webapp): selfhost apikey role cta (#4586) | ||
|
Katia Bulatova
|
480bede0ad |
feat(webapp,sdk): dashboard agent plan enforcement, component gallery — and fixes (#4516)
Plan enforcement for the dashboard agent — message quota and watch limits — plus the component gallery, fixes and test hardening from the same stack (#4548, #4549, #4550, #4552, #4556 merged here). ## Plan enforcement ([TRI-12863](https://linear.app/triggerdotdev/issue/TRI-12863)) **Agent message quota.** The Free-plan allowance becomes a real server-side limit with a durable counter. New `agent_message_usage` table keyed `(organization_id, period)` — deliberately not joined to chats, so deleting a chat can't free quota within the period. Both send paths count one user message (wakes never count) and refuse at the cap with `403 message_quota_reached`, which the client renders as an upgrade panel, never a silent drop. The refusal code is a single shared constant on both sides. **Watch limits.** A watch whose window exceeds the plan's `agentWatchMaxHours`, or that would push the org past its `agentWatchers` count, is refused with `watch_limit_reached` (409 on the API, an upgrade hint on the card). Plan limits only tighten the existing code ceilings (`min(plan, 24h)`, per-chat cap of 3 still applies). A plan limit of zero means zero, not unlimited. Questions answerable instantly are answered before any plan refusal — a one-shot consumes no slot and never sees an upgrade nag. **Fails open by design.** Cloud ships the actual per-plan numbers separately (TRI-12863 P0). Until then absent limits resolve to the unlimited sentinel and the upgrade UI is gated on billing presence — self-hosted sees no cap, no upsell, with tests proving the fallback. Both quotas are nudges, not security boundaries: a failing limit read never blocks a send. ## Component gallery An admin-only gallery of every agent card state: five `storybook.agent-*` pages (chat UI, view blocks, report, investigation, watch) with their shared shell and manifest, demo fixtures, two demo-only cards, toast examples, and the screenshot script. No LLM and no data — every state renders from fixtures under `dashboard-agent/demo/`, never reachable from a production path. Designers and reviewers can look at every state, including the report states, without seeding anything. ## And fixes **SDK: watch-mode chat subscriptions survive quiet windows** (TRI-13065, TRI-13070) — watch mode keeps reconnecting across empty long-poll windows and only stops on abort or a settled session; a passive subscriber can no longer stop a turn it doesn't own (`stopOnAbort` is explicit, default off). Review findings fixed alongside: a superseded stream's async teardown no longer removes the live successor's abort controller or multi-tab claim, and stopping a generation hands the chat back to the user's other tabs. **Query boundary pinned end-to-end** ([TRI-11165](https://linear.app/triggerdotdev/issue/TRI-11165)) — a route-level test drives `api.v1.query` with a real signed environment JWT (writes refused before ClickHouse, a read passes); `readonly=1` made non-overridable; a per-turn cap stops the model burning a turn rewriting a query it can't fix (deterministic SQL errors only — busy/transport rejections don't count). **chat.agent durability regression suite** ([TRI-11166](https://linear.app/triggerdotdev/issue/TRI-11166)) — testcontainers-backed coverage of the two audit criticals (cross-tenant isolation, no duplicate mid-stream turn, both control-broken) plus crash-resume, cursor-based refresh, clean rollback of a mid-write turn failure (torn by a real constraint violation), and OOM-restart replay. **Investigation sweep backoff** — stale investigations get an attempt counter and backoff so a poison row can't pin the sweep queue head (migration `0005`: `sweep_attempts`, `last_sweep_attempt_at`). ## Screenshots <img width="1440" height="791" alt="Screenshot 2026-08-06 at 00 36 19" src="https://github.com/user-attachments/assets/6a68cd42-8580-469d-afe7-e28d1eef18e1" /> 🤖 Generated with [Claude Code](https://claude.com/claude-code) |
||
|
Chris Arderne
|
ed1bb72fb8 |
feat: implement cron window spread backend (#4566)
- New DB fields on Schedule and ScheduleInstance - Use `queueTimestamp` for the "effectiveAt" delayed start time, propagate it to Clickhouse TaskRun table - Disable fastpath for delayed jobs - Add schedule timing logic, API endpoints with windows, persistence - Calculate phase for every schedule, only persist when window is non-null - Additional o11y for phased rollout |
||
|
Chris Arderne
|
3c5bbc1607 | fix(webapp): hard-navigate after creating a project (#4584) | ||
|
Matt Aitken
|
c2c6e5c705 |
fix(webapp): keep session runs off the legacy realtime streams backend (#4564)
## Summary Runs created for a Session were triggered without a realtime streams version, so they fell through to the `realtimeStreamsVersion` column default of `v1`. A Session's own `.in` / `.out` channels are always `v2`, so any run-scoped `streams.append()` or `streams.pipe()` call made inside a session run wrote to a different backend than the session it belongs to, and stayed there for the life of the run. The API trigger routes were never affected. They call `determineRealtimeStreamsVersion` with the client's `x-trigger-realtime-streams-version` header and always pass an explicit value, so a current SDK asking for v2 gets it. Only the internal callers that build trigger options by hand were leaning on the column default, which no env var can influence because that path never calls the resolver at all. ## The version resolver Fixing the call site exposed a second problem in `determineRealtimeStreamsVersion`. Its two paths disagreed: an explicit `v2` was checked against the S2 configuration first, but when the caller expressed no preference it returned `REALTIME_STREAMS_DEFAULT_VERSION` verbatim with no check. A deployment that set the default to `v2` without configuring S2 therefore stamped runs `v2`, nothing failed at trigger time, and every later read or write against those runs' streams threw `Realtime streams v2 is required for this run but S2 configuration is missing` for the life of the run. Both paths now resolve through one pure function that takes its configuration rather than reading `env`: ```ts const requested = streamVersion ?? config.defaultVersion; if (requested !== "v2") return "v1"; const hasCredentials = Boolean(config.accessToken) || config.skipAccessTokens; return hasCredentials && Boolean(config.basin) ? "v2" : "v1"; ``` ## The basin requirement `resolveStreamBasin` resolves run, session and organization basins ahead of the global setting, so a deployment that provisions a basin per organization can serve v2 with no global basin at all. Gating purely on the global setting would degrade every run there to `v1`. `determineRealtimeStreamsVersion` therefore takes an optional organization basin, and every caller that holds one passes it, including the session path: ```ts basin: organizationBasinName ?? env.REALTIME_STREAMS_S2_BASIN, ``` This is deliberately the resolved basin and not the `REALTIME_STREAMS_PER_ORG_BASINS_ENABLED` flag. The flag says the feature is on, not that a given organization has been provisioned, and provisioning happens out of band. Keying off the flag would stamp `v2` on runs for unprovisioned organizations, recreating the failure this removes. **This widens behaviour for explicit `v2` requests**, which previously required the global basin: a provisioned organization on a per-org deployment now resolves `v2` where it used to get `v1`. That is intentional, and it makes every path agree. ## Scope Only newly created runs change. A run already stamped `v1` keeps that version for its lifetime by design, since readers resolve the backend from the same column and its existing streams have to stay readable. Scheduled runs reach the same column default through `scheduleEngine.server.ts` and are deliberately left alone: that one is a policy question about `REALTIME_STREAMS_DEFAULT_VERSION` rather than an inconsistency inside a single feature. ## Verification A full-stack e2e boots the real webapp plus Postgres, Redis and s2-lite, creates a Session through the public API so the run comes from the real trigger path, appends records the way `streams.append()` does, and asserts three things at once: the version stamped on the run, that the payload is readable from S2, and that no key exists in Redis. It appends at a realistic record size so the route's body cap and S2's per-record cap are both exercised. Reverting the session-path change flips all three observations, so it fails against the old behaviour rather than passing vacuously. Unit tests cover the resolver matrix, including organization-basin-only and credential-only configurations; two of them fail against the previous resolver. Also verified by hand against a local stack: a real `chat.agent` session run writing 8 records of 250KB through `streams.append()` put 2,049,072 bytes into S2 with no Redis key, while the same agent with the session-path change removed put 2,102,360 bytes into Redis and nothing into S2. |
||
|
Chris Arderne
|
429c004118 |
fix(webapp): include Tailwind in production image (#4582)
fix(webapp): include Tailwind in production image ## Summary Include `tailwindcss` in the webapp production dependencies so self-hosted Docker images can render emails that use React Email's Tailwind component. |
||
|
Chris Arderne
|
7b390e5984 | feat(cli,webapp): allow deploys with environment API keys (#4561) | ||
|
Chris Arderne
|
26a730f908 | fix(webapp): externalize kapaai (#4580) | ||
|
Katia Bulatova
|
0b750d00dd |
feat(webapp): dashboard agent — Watch (#4525)
Watch is the agent noticing something later: you ask it to tell you when a condition holds, and it answers when it does — or when it can't any more. A watch is a **durable one-shot promise**. The condition is checked on a schedule by deterministic code (no LLM in the checks), the answer lands in the chat once, and then the watch is over. Ten kinds: three on a run, five on a queue, error recurrence, health recovery. ## Stack Stacked on **#4529** (UI), which is stacked on **#4418** (chat, reports, investigate). Merge those first. **#4516** (storybook gallery) sits on top of this branch. ## How to review [**GUIDEBOOK.md**](https://github.com/triggerdotdev/trigger.dev/blob/feat/dashboard-agent-flows-watch/internal-packages/dashboard-agent/GUIDEBOOK.md) on this branch is the behaviour reference — it states the conditions rather than the code, so you can predict what happens without running anything. "The ten watch kinds, and what makes each fire" and "Creating a watch" describe exactly this PR, and the tables there are the spec the code is written against. ## What's inside - **Ten watch kinds**, one deterministic check each (`dashboardAgentWatch*Checks.ts`), with the spec union in `dashboard-agent-contracts/src/watch.ts`. - **Scheduling** — each watch schedules its own next check; due watches of one `(environment, cadence)` group can be checked together in one batch pass, with a sweep as the backstop for expiry, redelivery and retention. - **Delivery** — the in-chat wake and card, an optional email alert (new `DASHBOARD_AGENT_WATCH` alert channel, so it shows on the project's Alerts page with one-click unsubscribe), and an optional investigation when the outcome needs attention. - **Submission ledger** — `watch_submissions`, keyed `(chat_id, client_request_id)`, so a retried card submission replays the recorded outcome instead of creating a second watch. - **Watch token** — a delayed-execution credential accepted only by the watch endpoints, re-checked against the user's live access on every tick. - **Unread work** — the panel polls for wakes that landed while it was closed, so a chat can go unread and light the launcher dot. ## Key decisions **A check result is a 4-way, and only two of them are verdicts.** `satisfied` / `terminal_unsatisfied` are answers; `pending` and `unavailable` are not. Any exception inside any check is caught in one place and becomes `unavailable` with an unverified observation — a check that failed is never evidence. **A completed window is an answer, and whether it is good or bad news is declared per kind, never inferred.** There is a table for that in the guidebook: `run_failed` completing its window is *good* news ("hasn't failed"), `backlog_drain` completing it is not. One rule overrides the table: a window that completed on an unverified observation is neutral and says only that the watch ended without a confirmed answer. **An unreadable source is never a negative answer** — and, because investigations only open on `attention`, it never starts one either. **Identity is `(chat, project, environment)` plus the condition,** enforced by a partial unique index over active rows (`watches_chat_active_identity_key`), not by the read-then-insert check. Cadence, window, note and `ticks` are deliberately not part of it. Two different chats may watch the same thing — a watch is a promise to a chat. **The server resolves the target's name, whatever the model calls it.** The model can't tell a task queue (`task/<id>`) from a custom queue, so both spellings are tried and the stored one wins — and the rewrite happens **before** identity and before the row is written, so the identity, the checks, the link and the wording all see one spelling. **Freshness fences.** Depth falls back from the live counter to the newest 60 s ClickHouse bucket, which only counts as current within 60 s of now. A non-current reading at or below the *quiet line* is refused as `unavailable` rather than believed, so a stale empty bucket is never read as "drained". The stall streak is the one piece of carried state: it lives in the previous check's facts and *freezes* on an unreadable reading rather than breaking. **Chain reliability.** There is no shared cron — each watch (or batch group) schedules its own next tick, so the failure mode to review is the chain dying. A failed batch check is caught, the next tick is scheduled anyway and the run resolves rather than failing, so the chain survives a check that couldn't run; the sweep re-arms groups and finalizes anything still active past its deadline, even when delivery isn't configured. Wake redelivery is id-deduped rather than conditional, because the sweep can't know whether the user was already told. Access is re-authorized on **every** check against the primary — replica lag would extend access the user has already lost. **Wording lives in one place.** `watch-wording.ts` is read by the card, banner, toast, email and the agent's own narration, and the numbers come from the frozen observation rather than a fresh read, so a retry produces the same sentence. Replay reproduces the **recorded** decision instead of deciding again — the transcript is append-once, so a second decision would contradict it forever. **Cancellation is the ending without an answer** — no resolution, no wake. One exception, decided during testing: a watch the *user* cancelled leaves a single neutral transcript line ("Stopped watching …"), keyed off the watch id so a retry can't repeat it. The other four reasons stay silent. **Email is opt-in and only a fired watch emails.** An expiry is narrated in the chat and nowhere else. Both gates (agent access, a configured email transport) are checked at subscribe time *and* again at delivery, and the subscription outcome is frozen on the ledger row so a retry replays it. Neither gate is a plan check. **One watch offer per turn.** The prompt and the renderer guard this independently — if the turn already proposed a watch card, the action button is dropped, because the card is the better affordance. Two eval cases pin the prompt side: exactly one offer with the line last and the button after it, and zero offers when the rendered card already carries one — deterministic assertions, over a real-model run. ## Testing Unit tests (vitest, testcontainers, no mocks) under `apps/webapp/test/dashboardAgentWatch*.test.ts` and `internal-packages/dashboard-agent/src/watch-*.test.ts` cover the invariants above: the 4-way check results and the freshness fences, identity/dedup and the submission ledger, queue-name resolution, the batch chain surviving a failed check, sweep boundaries and alert-once, tenancy and the watch token's scope, and the wording snapshot. The load-bearing ones were verified by control-breaking the guard first and checking the test goes red. Live-tested end to end against a local stack, following the guidebook: all ten watch kinds firing and expiring, cancellation, the email pair (a fired watch mails, an expired one does not), and watch recovery from a health report. |
||
|
Eric Allam
|
326e9950f4 |
perf(webapp): scope declarative schedule sync to the current environment (#4577)
## Summary Background worker registration runs on every deploy and every `trigger dev` file save. Its declarative-schedule reconcile loaded every declarative schedule for the whole project across all environments, then re-fetched the deletion candidates it already had in memory. For projects with many scheduled tasks or many environments, that meant reading tens of thousands of rows on each registration. This scopes the load to the environment being registered, drops the redundant re-fetch, and selects only the columns the reconcile needs. It also fixes the schedule-limit count (`getUsedSchedulesCount`), which joined `TaskSchedule` and `RuntimeEnvironment` without a project constraint and could scan those tables in full. Pushing `projectId` onto both joins gives it a project-scoped index path with the same result. Follow-up to [#4522](https://github.com/triggerdotdev/trigger.dev/pull/4522), which batched the delete side of the same reconcile. |
||
|
Eric Allam
|
26cdedda1c |
perf(webapp): scope env var create pre-check to submitted keys (#4579)
## Summary Setting or importing environment variables ran a conflict pre-check that loaded every variable in the project and every value across all of its environments, only to decide whether the submitted keys already had a value in the target environments. On projects with many variables and environments that meant reading tens of thousands of rows on each create/import call. This scopes the pre-check to the submitted keys and target environments, so it reads only the rows it actually inspects (submitted keys × target envs), wrapped in `boundedIn` to keep the prepared-statement cache stable. Same conflict detection, a handful of rows instead of the whole project's env-var values. |
||
|
Katia Bulatova
|
9a3bee0288 |
feat(webapp): dashboard agent — UI (#4529)
Stacked on #4418. Merge that first. The UI slice of the dashboard agent: the side panel, the chat transport wiring, message and card rendering, suggested prompts, and chat history. #4418 works without this — the system is simply invisible. The diff is mostly components, so the notes below cover only the three decisions you can't read off the markup. Behavior and a hands-on walkthrough live in GUIDEBOOK.md, which lands with #4525. ## Decisions worth knowing - **Action rows always render at the end of a turn.** The model's emission order isn't trusted for layout, so action blocks are split out of the stream and appended last. Display only — `answered` stays keyed on the emission index. - **The last-chat memory is org-true.** It's keyed by the chat's own organization, and a foreign or deleted chat comes back as a 404 the client treats as gone, rather than an empty chat it keeps around. - **A dead stream self-heals from the settled transcript.** Terminal records are written to the chat row after the client's stream closes, so the panel re-reads it. The poll gate is any unfinished turn — a dangling tool part, not just an open investigation. ## Notes - Gated by `canAccessDashboardAgent`; no behavior change with the flag off. - Page marks: `handle.agentPageContext` on 47 routes, ~20 lines each. - Entry points: Ask Trigger button, ⌘J, Help & Feedback. The old ⌘I and `?aiHelp=` links keep working. ## Screenshots <img width="1440" height="788" alt="Screenshot 2026-08-07 at 15 14 29" src="https://github.com/user-attachments/assets/f4e89e8d-13ed-4be3-a88d-d5cca3ece0fa" /> |
||
|
Katia Bulatova
|
4569657923 |
feat(webapp): dashboard agent — chat, reports, investigate (#4418)
## What & why This is the system behind the Dashboard Agent — an assistant that answers questions about a project's runs, errors, queues, deploys and health, and can investigate failures end to end. The agent runs as a chat.agent task in its own Trigger project. It has no access to the main database or ClickHouse; all platform data is read through the public API using a delegated, read-only user token. Everything here is behind `canAccessDashboardAgent` and inert with the flag off. The UI that mounts the panel lands in #4529. ## Stack `#4418` (this, base) ← `#4529` UI ← `#4525` Watch ← `#4516` storybook gallery. The scenario/contract reference for the whole stack is `internal-packages/dashboard-agent/GUIDEBOOK.md` (it lands on the Watch branch): it states, per feature, what makes each thing happen and where that is decided. ## What's inside **Agent runtime and tools** — `internal-packages/dashboard-agent`: prompt, tool set (API reads, TRQL query, docs, navigation, evidence/investigations, repo source), conversation compaction, a prompt-prefix token budget pinned by snapshot test, and sampled LLM-judged turn evals. The package cannot import webapp server code, which is what makes the "no DB access" claim structural rather than a convention. **Contracts** — `internal-packages/dashboard-agent-contracts`: `trigger://` URIs, intents, and the block envelope every rendered card travels in. **Conversation store** — `internal-packages/dashboard-agent-db`: drizzle over postgres-js in its own `trigger_dashboard_agent` Postgres schema, plus one additive migration. **Auth boundary** — the user-actor token gains an optional environment claim; one guard (`userActorEnvironment.server.ts`) enforces it so routes don't each re-derive the rule. Token minting, cap ceiling, and the RBAC fallback path for self-hosted. **Transport** — webapp resource routes that mint the token and proxy each turn, and SDK-side mid-turn reconnect. **Public API the agent reads through** — orgs, projects, environments, runs, queue metrics, workers, a run's commit metadata, repo snapshot, reports, and `POST /api/v1/query`. **Reports** — the health report's layout is declared once and shared by the card, the markdown surface and the JSON/MCP surface, so the same report reads the same in the dashboard, the terminal and an editor. **Block renderers** — the report and investigation cards the flows above already emit (`app/components/dashboard-agent/`). The panel that hosts them, and the rest of the chat UI, is #4529. **Query safety and CSP** — see below. ## Key decisions - **The agent is a separate Trigger project, not webapp code.** It reads platform data over the public API with a delegated user-actor token whose `cap` ceilings it to read scopes. No Prisma, no ClickHouse, no webapp imports. - **The PAT-only auth helper now refuses user-actor tokens.** This is an intentional behavioral change: its callers consume only a bare userId and do not enforce delegated-token capabilities. Actor-aware routes continue through the scoped route builders instead. - **RBAC fallback builds a delegated token's ability from its own cap**, never the blanket ability a PAT gets (read-only when the token declares none). Without this, the agent's read-only cap would buy a write JWT on self-hosted. - **Org creation checks RBAC only for user-actor tokens, and only after the env gate**, so an install with `ORG_CREATION_API_ENABLED` off returns 404 rather than 403, and an ordinary PAT never consults an ability the route has no org to scope. Both orderings are pinned by test. - **The query path is read-only in depth.** TRQL rejects write statements at the grammar level (they don't parse, rather than being filtered), ClickHouse runs with `readonly=1`, and the org/project/env filters are injected server-side from the credential — the request body cannot widen scope. An unparseable query denies instead of falling through to the permissive resource. - **Document-wide img-src CSP.** Remote images are an outbound-request/exfiltration surface, so the policy permits only own-origin/data/blob, the required SSO avatar hosts, and the favicon endpoint. Operators can add exact origins through CSP_IMG_SRC_ALLOWLIST; wildcard hosts and bare schemes are intentionally not allowed. - **The chat transport reconnects on a mid-turn EOF** (`@trigger.dev/sdk`). A body that ends without a turn-complete is terminal only when the server says `X-Session-Settled: true`; otherwise the transport resubscribes from `lastEventId` with bounded backoff, and any record re-earns the budget. Previously a closed long-poll window or a proxy restart left the reply stuck as if still generating. - **Conversations live in their own datastore**, schema-scoped and foreign-key-free (it references `organizationId`/`userId` by id, because in cloud it is a different database). It is a display read-model for the History tab and transport resume; `chat.agent`'s object-store snapshot remains the model's source of truth. - **Deterministic first.** Reports and health checks contain no LLM — they are computed from the same data the dashboard shows, and the model only narrates and links them. That is what makes a number in an answer auditable. ## Testing - 63 new test files, run with `pnpm run test --filter webapp` and per-package vitest. Heaviest coverage on the auth boundary (`userActorPatOnlyBoundary`, `userActorTokenClaimsAndScopes`, `contextlessPatRoutes`, `rbacFallbackBranch`), TRQL read-only, the report layout, and the SDK reconnect. - The agent package has a separate eval lane (`pnpm run test:evals`, `vitest.eval.config.ts`) that hits the real model, so it never runs in `pnpm test`. - Live-tested against a local stack scenario by scenario; the GUIDEBOOK lists the condition each behaviour is expected under, which is what those runs were checked against. ## Changelog `.server-changes/dashboard-agent.md`, plus changesets for `@trigger.dev/core` (report schemas), `@trigger.dev/sdk` (chat reconnect) and the CLI's `mint-token` help text. |
||
|
Saadi Myftija
|
02de2e693f |
feat(api): separate rate limit budget for deployment endpoints (#4565)
Most deploy-flow API calls shared the general per-environment rate limit bucket with all of that environment's runtime traffic, so an org with heavy API usage could intermittently 429 its own deploys; the `/api/v*/deployments` endpoints themselves were fully exempt from rate limits as a stopgap ([#2774](https://github.com/triggerdotdev/trigger.dev/pull/2774)), which promised a dedicated limiter as the follow-up. This is that follow-up: the whole deploy-flow group now runs on its own budget, separate from runtime API limits. ### Design A new `deploymentRateLimiter` covers every endpoint the deploy flow depends on: the `/api/v*/deployments` group, the env API key exchange (`/api/v1/projects/:ref/:env`), build-time env var resolution and sync (`/envvars`, `/envvars/:slug/import`), preview branches, `/api/v1/remote-build-provider-status` and `/api/v1/artifacts`. The general API limiter whitelists the same shared path list, so exactly one limiter applies to each path and the two can't drift apart. Buckets are keyed per environment for environment API keys and per token for the PAT-authenticated phase of a CLI deploy (whoami, key exchange, branches). The deploy budget is controlled via the `DEPLOYMENT_RATE_LIMIT_*` env vars. |
||
|
claude[bot]
|
8819e25751 | fix(webapp): hard-navigate after creating an organization (#4530) | ||
|
DKP
|
336f515001 |
docs(ai): add LLM observability page (#4568)
## Summary

Adds a docs page for LLM observability: every opted-in Vercel AI SDK
call inside a task becomes its own span in the run trace, carrying the
model, provider, token counts, cost, and latency. The page covers
turning it on per call with `experimental_telemetry: { isEnabled: true
}`, what each span inspector tab shows (Overview, Messages, Tools, and a
Prompt tab when linked), linking a call to its prompt version with
`toAISDKTelemetry()`, and querying usage across runs with TRQL against
the `llm_metrics` table.

It sits in the AI dropdown under Features, next to
[Prompts](https://trigger.dev/docs/ai/prompts), and cross-links the
[Query](https://trigger.dev/docs/observability/query) page.

It is explicit that capture is opt-in per call (not automatic) and only
covers Vercel AI SDK calls, and notes the `@ai-sdk/otel` requirement on
AI SDK 7. Every API name, span tab, and TRQL column was checked against
the SDK and the live query schema.

## Also in this PR

Corrects one bullet in the [AI Agents
overview](https://trigger.dev/docs/ai-chat/overview): it claimed an
in-progress chat resumes on the new version after a redeploy, which
contradicts the version-upgrades and backend pages. Chat agent runs are
pinned to the version they started on; moving onto new code is an
explicit version upgrade.
|
||
|
DKP
|
e367899510 |
docs(ai-agents): add chat.agent guide and refresh the AI agent guides (#4524)
## Summary Adds a "Build a chat agent" guide to the AI agents section, surfaces the ClickHouse chat agent example in the guides index and the AI agents overview, and refreshes the five existing workflow guides so their code is current. ## Details The pattern guides (prompt chaining, routing, parallelization, orchestrator, evaluator-optimizer) still used retired models and dated APIs. Updated them to current Anthropic Claude models (claude-haiku-4-5 for lightweight classifier roles, claude-sonnet-4-5 for the main work) and modernized the code: - route-question uses generateObject for the routing decision instead of generateText plus manual JSON parsing. - verify-news-article uses ModelMessage in place of the renamed CoreMessage. - Fixed translate-and-refine discarding its recursive refinement result, so refined translations never returned to the caller. - Fixed an invalid JSON test payload in generate-translate-copy. The pattern concepts are unchanged; only the example code was stale. |
||
|
Eric Allam
|
6449a644b9 |
feat(webapp,cli,database): track real dev onboarding progress (#4563)
## Summary

The dev environment "Get set up" panel used to be a static list of CLI
commands that only disappeared once your tasks registered, so nothing
ever changed after you ran `init` and people assumed it was stuck. It
now tracks real progress: `trigger init` records the project as
initialized, so step 1 checks off, and the panel updates live as the dev
server connects and your tasks register.

It also adds a prominent "Copy AI agent prompt" button, presented as a
clear alternative ("or") to the manual CLI steps, that copies a
ready-to-paste setup prompt pre-filled with your project reference for
Claude Code, Cursor, or any coding agent.

## Notes

- Adds a `Project.initializedAt` column (migration
`20260811065646_add_project_initialized_at`); the CLI `init` command
calls a new project-scoped `POST /api/v1/projects/:ref/init` best-effort
at the end of setup.
- The `init` scaffold now imports from `@trigger.dev/sdk` instead of the
deprecated `/v3` subpath.

## Screenshots

<img width="2400" height="1794" alt="v7-redesigned-card"
src="https://github.com/user-attachments/assets/c2fb4fa1-9484-4700-8bd3-110d66f5a44e"
/>
|
||
|
Eric Allam
|
820c079145 |
perf(webapp): read per-run environment config from the replica at dequeue (#4560)
🚀 Publish Trigger.dev Docker / typecheck (push) Failing after 0s
🚀 Publish Trigger.dev Docker / units (push) Failing after 0s
🚀 Publish Trigger.dev Docker / publish-webapp (push) Has been skipped
🚀 Publish Trigger.dev Docker / publish-worker-v4 (push) Has been skipped
🚀 Publish Trigger.dev Docker / scan-webapp (push) Has been skipped
🚀 Publish Trigger.dev Docker / scan-supervisor (push) Has been skipped
🦋 Changesets PR / Create Release PR (push) Has been cancelled
🚀 Publish Trigger.dev Docker / 📣 Dispatch main image (push) Has been cancelled
## Summary Adds an opt-in path to serve a run's per-run configuration reads from the control-plane read replica instead of the primary, reducing primary database load during task execution. The managed-worker dequeue resolves each run's environment, organization, and environment variables before starting the run; those rows are stable for the life of a run, so they can safely come from the replica. Gated by `CONTROL_PLANE_DEQUEUE_READS_FROM_REPLICA`, defaulting to `"0"` (reads from the primary, unchanged from today). Set it to `"1"` to route the reads to the replica. The env-var read is scoped to the dequeue/resolution path (`resolveVariablesForEnvironment`); dashboard env-var reads and writes always stay on the primary. When no read replica is configured, `$replica` transparently falls back to the writer, so single-database self-host is unchanged either way. Verified end-to-end against a real primary/replica split, in both `trigger dev` and deployed (managed-worker) runs: with the flag on, env vars inject correctly and a value set immediately before triggering a deployed run is present on the run. |
||
|
Iss
|
1038641b15 |
chore: vouch Jakub-Vacek (#4559)
Adds [Jakub-Vacek](https://github.com/Jakub-Vacek) to the list of vouched outside contributors so their PRs aren't auto-closed by the vouch check. |
||
|
Eric Allam
|
ce368dd8e0 |
perf(database): index EnvironmentVariableValue.valueReferenceId so secret deletes stop seq-scanning (#4555)
## Why this change `EnvironmentVariableValue.valueReference` is an `onDelete: SetNull` foreign key. Deleting a `SecretReference` (the env var edit/delete path for secret values) fires the cascade `UPDATE ONLY "EnvironmentVariableValue" SET "valueReferenceId" = NULL WHERE $1 = "valueReferenceId"`. That cascade is scan-shaped: with no index on `valueReferenceId`, it reads the entire table to find the rows referencing the deleted secret. The parent `SecretReference` delete does almost no work itself; its latency is dominated by this cascade. ## Diagnosis `EnvironmentVariableValue` was indexed on `environmentId` and `(variableId, environmentId)`, but not on `valueReferenceId`. The SET NULL cascade therefore did a full sequential scan of the whole table. Two sibling SET NULL cascades on the same delete (`OrganizationIntegration.tokenReferenceId`, `User.mfaSecretReferenceId`) are index-backed and stay fast, which isolates the missing index as the cause. ## Change Add `@@index([valueReferenceId])` on `EnvironmentVariableValue`, created with `CREATE INDEX CONCURRENTLY IF NOT EXISTS` so `prisma migrate deploy` stays safe on a live table. ## Benchmark (local, seeded) Local Postgres seeded with 1,000,000 `EnvironmentVariableValue` rows, `EXPLAIN (ANALYZE, BUFFERS)` on the SET NULL cascade with zero matching rows (the worst case: reads the whole table, affects nothing): | | before | after | |---|---|---| | plan | Seq Scan (1M rows) | Bitmap Index Scan | | execution | 183 ms | 2.8 ms | In a variant where the secret matched several thousand rows, the parent `SecretReference` delete's `EnvironmentVariableValue_valueReferenceId_fkey` trigger dropped from 216 ms to 88 ms (the residual is the heap work of nulling those rows). ## Expected impact The cascade drops from a full-table sequential scan to a targeted index lookup. The win grows with the table, so the benefit is larger than the seeded numbers above. ## Risks - One extra btree to maintain on `EnvironmentVariableValue` writes; small, single-column, and it should be pre-created before the migration deploys (per the repo index rules). - No behavior change: same rows nulled, no ordering or result-set change, read paths untouched. Companion to the same fix on `ProjectAlert.channelId`. |
||
|
Eric Allam
|
4c58091973 |
perf(database): index ProjectAlert.channelId so alert-channel deletes stop seq-scanning (#4554)
## Why this change Deleting a `ProjectAlertChannel` fires the FK cascade `DELETE FROM ONLY "ProjectAlert" WHERE $1 = "channelId"`. That cascade is scan-shaped: with no index on `channelId`, it reads the entire `ProjectAlert` table to find the few child rows belonging to the deleted channel. The parent `DELETE ProjectAlertChannel` does almost no work itself; its latency is dominated by this cascade. `ProjectAlert` is append-heavy and grows over time, so the scan cost only increases. ## Diagnosis `ProjectAlert` had no index on `channelId` (only `pkey` + a `friendlyId` unique). The cascade therefore did a full sequential scan of the whole table. The sibling `ProjectAlertStorage` cascade on the same delete is index-backed and stays fast, which isolates the missing index as the cause. ## Change Add `@@index([channelId])` on `ProjectAlert`, created with `CREATE INDEX CONCURRENTLY IF NOT EXISTS` so `prisma migrate deploy` stays safe on a live table. ## Benchmark (local, seeded) Local Postgres seeded with 1,000,000 `ProjectAlert` rows across 50 channels (~20k rows per channel), `EXPLAIN (ANALYZE, BUFFERS)` on the cascade delete: | | before | after | |---|---|---| | plan | Seq Scan (1M rows) | Bitmap Index Scan | | direct child delete | 740 ms | 22 ms | | parent delete `ProjectAlert_channelId_fkey` trigger | 77.7 ms | 23.8 ms | ## Expected impact The cascade drops from a full-table sequential scan to a targeted index lookup. The win grows with the table: the more rows in `ProjectAlert`, the more a scan costs and the more the index saves, so the benefit is larger than the seeded numbers above. ## Risks - One extra btree to maintain on every `ProjectAlert` insert; acceptable for a single-column index on a high-insert table, and it should be pre-created before the migration deploys (per the repo index rules). - No behavior change: no rows orphaned, no ordering or result-set change, read paths untouched. ## Follow-up `ProjectAlert`'s other cascade FK columns (`projectId`, `environmentId`, `workerDeploymentId`) are also unindexed, but their parents are soft-deleted rather than physically removed, so those cascades do not currently fire. Lower priority unless a hard-delete path is introduced. |
||
|
Eric Allam
|
951d8e8d7b |
feat(webapp): per-client database pool metrics that survive the driver adapter (#4541)
## What Follow-up to #4539. The driver-adapter work is inert until a client flips to the pg driver adapter, but the moment one does, our database observability degrades: the OTel metrics pipeline reads pool stats from Prisma's `$metrics`, which is owned by the Rust engine's `quaint` pool. Under the adapter, `pg.Pool` owns the pool, so those gauges read zero. The pipeline also only ever scraped a single client (the control-plane writer singleton). This PR makes database metrics driver-agnostic and per-client: - Every configured client registers a metrics source: control-plane writer/replica, run-ops writer/replica, legacy writer/replica. Previously only the control-plane writer singleton was scraped. - Each OTel instrument is observed per client with `db_client` and `db_driver` (`quaint` | `pg-adapter`) attributes. `db_client` uses our canonical datasource-role labels (`control-plane-writer`, `control-plane-replica`, `run-ops-writer`, `run-ops-replica`, `legacy-run-ops-writer`, `legacy-run-ops-replica`) — the same strings used for the `db.datasource` span attribute, so a metric and a trace point at the same pool. - Pool figures come from the authoritative source per driver: - **pg-adapter**: `pg.Pool` (`totalCount`/`idleCount`/`waitingCount`, plus cumulative opened/closed from `connect`/`remove` events). - **quaint**: the Rust engine's `$metrics` pool gauges/counters, exactly as before. - Query counters and duration histograms still come from `$metrics` for both drivers (the Rust engine executes queries in both cases). - New `db.pool.connections.waiting` gauge (pg.Pool exposes this; quaint reports 0). - Stops exporting Prisma metrics from the Prometheus `/metrics` route. Pool observability now lives entirely in the OTel pipeline, per driver, per client. ## Why So we can flip any client (including the control-plane writer, the primary desync-fix target) to the driver adapter without losing pool visibility. Existing dashboards keyed on the same metric names keep working; they gain a per-client dimension. ## Testing Unit (`apps/webapp/app/utils/databaseMetrics.server.test.ts`): the pure normalizer — quaint reads pool from `$metrics`; adapter reads pool from `pg.Pool` and keeps engine query metrics; `busy` never goes negative; graceful zeroing when `$metrics` is unavailable (adapter still reports live pool figures). Live smoke test against a prod-shaped local stack: three physically-distinct Postgres DBs (control-plane, run-ops, legacy) behind dual PgBouncers, split mode on, with a mix of adapter and quaint clients. Reading the actual emitted OTel metrics, every pool shows up as its own series: ``` db.pool.connections.total{db_client="control-plane-writer", db_driver="pg-adapter"} = 1 db.pool.connections.total{db_client="control-plane-replica", db_driver="quaint"} = 1 db.pool.connections.total{db_client="run-ops-writer", db_driver="pg-adapter"} = 1 db.pool.connections.total{db_client="run-ops-replica", db_driver="quaint"} = 1 db.pool.connections.total{db_client="legacy-run-ops-writer", db_driver="quaint"} = 1 db.pool.connections.total{db_client="legacy-run-ops-replica",db_driver="quaint"} = 1 db.client.queries.total{db_client="control-plane-writer",db_driver="pg-adapter"} = incrementing db.client.queries.duration.count{db_client="control-plane-writer",db_driver="pg-adapter"} = incrementing ``` Confirms: metrics are attributed per pool with the correct driver; adapter pools' figures come from `pg.Pool`; and query counters/duration histograms keep incrementing under the pg adapter. Also verified `/metrics` (Prometheus) now returns zero `prisma_*` series while still serving the app's own metrics. `pnpm run typecheck --filter webapp` passes. ## Notes - `/metrics` (Prometheus) no longer includes `prisma_*` series. Anything scraping that endpoint for Prisma metrics should read the equivalent `db.*` metrics from the OTel exporter instead. - **PgBouncer + `?schema=` gotcha (separate from this PR, worth flagging for rollout):** since #4539 parses `?schema=` from the DSN and passes `{ schema }` to the adapter, node-postgres sends `search_path` as a startup parameter. A transaction-mode PgBouncer rejects that with `FATAL: unsupported startup parameter: search_path`. Our prod control-plane DSNs use the default `public` schema with no `?schema=` param, so this is latent, but any client we flip to the adapter must not carry `?schema=` in its DSN (or the pooler needs `ignore_startup_parameters = search_path`). --------- Co-authored-by: Claude Opus 4.8 (1M context) <noreply@anthropic.com> |
||
|
Saadi Myftija
|
bd8ce4a50f |
feat(deployments): split project dependencies and code into separate layers (#4551)
Deploy images previously shipped node_modules and the bundled task code in a single layer, so every deploy re-pushed and re-pulled the full dependency tree even when nothing in it changed. The generated Containerfile now copies `/app/node_modules` as its own layer and the app files separately. With unchanged dependencies the dependency layer is identical across deploys, so registries and workers already have it and only the code layer moves. |
||
|
Katia Bulatova
|
c00fb9c36c |
fix(webapp): report start latency as unknown when there is no data (#4544)
When the health report had no start-latency measurement for the window, it printed a confident "p95 0ms" and graded it healthy. It now shows "unknown" for that metric and skips grading it, so an absent measurement can't read as a green signal. A genuinely measured 0ms is still shown as 0ms: the loader keeps "no measurement" distinct from a measured zero instead of coercing both to 0. |
||
|
nicktrn
|
6e00aaf92b |
chore(deps): bump transitive mermaid to 11.16.1 (#4553)
## Summary Bumps the transitive `mermaid` in the lockfile from `11.14.0` to `11.16.1`. `mermaid` has no direct dependents here. It arrives through `streamdown`, which declares it as a hard dependency even though diagram rendering is gated behind the optional `@streamdown/mermaid` plugin, which we don't install. `streamdown@2.5.0` is its latest release, and its declared range (`^11.12.2`) already permits `11.16.1`, so this was a stale lockfile pin rather than a range conflict. Done as a scoped override rather than a bare lockfile refresh, so the floor survives a lockfile regenerated from an older base: ```json "mermaid@>=11 <11.16.1": "^11.16.1" ``` Net effect is 96 fewer lockfile lines, contained to mermaid's own subtree. `11.16.1` swapped out its parser, so the `langium` / `chevrotain@12` / `vscode-languageserver-*` chain drops in favour of a single `@chevrotain/types`, and `lodash-es` and `uuid@11` are no longer pulled at all. The override goes away once `streamdown` makes `mermaid` an optional peer of its diagram plugin instead of a hard dependency. |
||
|
Eric Allam
|
90e8bd5c12 |
feat(webapp,database): opt-in per-client Prisma driver adapters (#4539)
🚀 Publish Trigger.dev Docker / typecheck (push) Failing after 0s
🚀 Publish Trigger.dev Docker / units (push) Failing after 0s
🚀 Publish Trigger.dev Docker / publish-webapp (push) Has been skipped
🚀 Publish Trigger.dev Docker / publish-worker-v4 (push) Has been skipped
🚀 Publish Trigger.dev Docker / scan-webapp (push) Has been skipped
🚀 Publish Trigger.dev Docker / scan-supervisor (push) Has been skipped
🦋 Changesets PR / Create Release PR (push) Has been cancelled
🚀 Publish Trigger.dev Docker / 📣 Dispatch main image (push) Has been cancelled
📚 Docs Checks / check-broken-links (push) Has been cancelled
🧭 Helm Chart Prerelease / lint-and-test (push) Has been cancelled
Workflow Checks / Actionlint (push) Has been cancelled
Workflow Checks / Zizmor (push) Has been cancelled
🧭 Helm Chart Prerelease / prerelease (push) Has been cancelled
## What

Adds an opt-in path to run each Prisma client through
**`@prisma/adapter-pg`** (the node-postgres driver) instead of the
built-in engine driver, controlled by a **per-client env var, all off by
default**:

| env var | client |
|---|---|
| `CONTROL_PLANE_DATABASE_WRITER_DRIVER_ADAPTER` | control-plane writer
|
| `CONTROL_PLANE_DATABASE_REPLICA_DRIVER_ADAPTER` | control-plane
replica |
| `RUN_OPS_DATABASE_WRITER_DRIVER_ADAPTER` | new run-ops writer |
| `RUN_OPS_DATABASE_REPLICA_DRIVER_ADAPTER` | new run-ops replica |
| `RUN_OPS_LEGACY_DATABASE_WRITER_DRIVER_ADAPTER` | legacy run-ops
writer |
| `RUN_OPS_LEGACY_DATABASE_REPLICA_DRIVER_ADAPTER` | legacy run-ops
replica |

With every flag unset the construction path is byte-identical to today
(`datasources` URL + Rust engine), so this is inert until a flag is
turned on. Per-client granularity allows enabling the adapter only where
it's wanted.

## How

- Enables the `driverAdapters` preview feature on both schemas
(`@trigger.dev/database` and `@internal/run-ops-database`). This keeps
the **Rust query engine** — it does NOT add `queryCompiler` — so query
behavior, result types, and engine tracing spans are unchanged.
- A shared `buildDriverAdapterPool` builds each client's `pg.Pool` with
an explicit `max`, a bounded `connectionTimeoutMillis` (the
node-postgres pool otherwise waits unbounded on acquire), and an
`onPoolError` handler (an unhandled idle-connection error would
otherwise crash the process). Threaded through all four client builders
via a `useDriverAdapter` flag.
- Adds `@prisma/adapter-pg` + `@types/pg` to the webapp; `pg` is already
pinned at `8.15.6` (adapter-pg 6.x requires `pg < 8.17`).

## Connect-failure handling (the important correctness/security bit)

Under the adapter an unreachable DB no longer surfaces as
`PrismaClientInitializationError` / `P1001`; it becomes a `P2010`
"Database not reachable: <host>" (or a raw
`ECONNREFUSED`/`ENOTFOUND`-class error). Two handlers are updated so a
client on the adapter behaves like today:

- **`isInfrastructureError`** now recognizes those shapes (P2010 with a
connectivity message, and raw connectivity errno codes). Without this,
the DB **hostname would leak into API-client-facing errors** and the
failure would go unlogged. Security-relevant.
- **`isPrismaRetriableError`** treats the adapter's pool-acquire timeout
("timeout exceeded when trying to connect") as retriable, preserving the
`P2024` retry behavior the adapter otherwise drops.

## Evidence

Validated on an isolated stack that mirrors the production DB topology
(chained PgBouncers in front of writer + reader):

- **Behavioral parity:** raw-query results and Prisma error codes/`meta`
are byte-identical between the engine driver and the adapter across the
queried shapes (unique-constraint `meta.target`, record-not-found,
transaction-timeout, serialization-failure, etc.).
- **Feature matrix:** a full 380-project queue-ay pass shows no
adapter-caused regressions — pass/fail parity between adapter-off and
adapter-on, with the residual failures being pre-existing
known-failures/flakes common to both.

## Rollout / rollback

All flags default off; enable per client via env var, roll back by
unsetting and redeploying (no data migration). Recommended first target
is a single writer; enable one client at a time.

## Follow-ups (not in this PR)

- `$metrics`-based pool observability is removed under the adapter (the
Prometheus route + `db.pool.connections.*` instruments); the metrics
replacement (via `pg.Pool` counters) lands in a separate PR.
- Note for operators: on the adapter path, interactive-transaction
`maxWait` does not bound pool acquisition — `connectionTimeoutMillis`
does.

## Note on connection-string parameters

The adapter pool is built from the base DSN, so Prisma-specific DSN
parameters that node-postgres does not understand are not honored when a
client is on the adapter:

- **Prisma TLS spellings** (`sslaccept`, `sslcert`, etc.) —
node-postgres uses `sslmode`/`ssl` instead. Our production DSNs do not
use these Prisma-specific TLS params, but any deployment whose DSN
relies on them must be checked before enabling a flag.
- `pgbouncer=true` and `statement_cache_size` — effectively moot under
the adapter, which uses no persistent named prepared statements.

`connection_limit`, `pool_timeout`, and `schema` are handled explicitly
(passed as `max`/`connectionTimeoutMillis` and PrismaPg's `{schema}`
option).

refs TRI-13039

---------

Co-authored-by: Claude Opus 4.8 (1M context) <noreply@anthropic.com>
|
||
|
Eric Allam
|
c526528d8f |
feat(webapp,database): bound Prisma list filter arity (#4480)
⚒️ Publish Worker (v4) / build (supervisor) (push) Has been cancelled
## Summary

Prisma expands `in` / `notIn` into one bind parameter per element, so
every distinct list
length is a separate prepared statement. Where the length tracks data
volume (a batch size,
a run-graph fan-out, a prior query's id set) one call site can mint
hundreds of them. Each
is used about once, but inserting it evicts an entry that was being
reused, so the cost
lands on unrelated queries sharing the pooler's statement cache. An
unbounded list also
risks the 65535 bind-parameter ceiling.

`boundedIn()` pads a filter list to the next power of two by repeating
its last element.
`IN` and `NOT IN` ignore duplicates, so results are unchanged, and a
call site drops from
one statement per length to at most `log2(cap)`. Applied to all existing
sites.

## Enforcement

Two oxlint rules require the helper: a list filter must be an inline
array literal or a
`boundedIn()` call.

- The first covers filters reached through `where` / `having` /
`cursor`, and deliberately
never descends into `data`, `create`, `update`, `set` or `equals`. A key
named `in` in
those positions is user data, not a predicate, and rewriting it would
corrupt what gets
  stored or compared.
- The second covers bare filter objects passed to where-building
helpers, which the first
cannot see. It found five sites in the run-graph batch loaders that were
otherwise
  invisible.

Both rules follow filters through the shapes they are actually written
in: conditional
expressions, logical-and objects, spread-conditional properties,
computed keys, and call
arguments. An array literal only counts as fixed-arity when nothing
spreads into it, since
`[...new Set(ids)]` has a runtime length. Twelve sites were hidden
behind those shapes
until the rules handled them.

Scoped to `in` and `notIn`. The scalar-list filters `hasSome` and
`hasEvery` compile to
`&& $1` and `@> $1`, passing the whole array as a single bind parameter,
so their arity never
reaches the statement text and there is nothing to bound.

Both rules are `error`, so new call sites fail CI. That ratchet has
already caught four
sites added by other PRs while this one was in review.

## Notes

`boundedIn` pads by repeating rather than with null: `x NOT IN (a, b,
NULL)` is never true,
so null-padding a `notIn` filter would silently return no rows. Lists
above 32768 are
returned unchanged so padding can never push a query past the parameter
limit.

Route modules reach the helper through `~/db.server` rather than
importing the database
barrel directly, since a value import of that barrel into a module that
also exports a React
component is only safe while dead-code elimination prunes it.

Measured on a local rig: 300 distinct list lengths produce 300 prepared
statements
unpadded, 10 padded. Verified end-to-end against a local stack with the
full task-suite
sweep, which surfaced no regressions.
re2-test-supervisor-main-c526528 re2-prod-supervisor-heatwave-dualwrite |
||
|
Eric Allam
|
63176a6d69 |
fix(webapp): stop api inheriting inbound sampled traceparents so trace sampling applies (#4532)
## What The internal tracing `ParentBasedSampler` in `tracer.server.ts` left `remoteParentSampled` at its default of `AlwaysOn`. Any request arriving with a `traceparent` whose sampled flag was set got recorded in full, bypassing `INTERNAL_OTEL_TRACE_SAMPLING_RATE` entirely. Because the SDK propagates its (always-sampled) trace context on calls back to the platform from inside running tasks, the large majority of API server spans inherited a sampled parent and ignored the divisor. The sampling knob was effectively inert on the busiest service. This registers a custom propagator (`NonInheritingTraceContextPropagator`) that stops adopting the inbound trace as the parent: - `inject` still delegates to the standard W3C trace + baggage propagators, so outbound propagation is unchanged. - `extract` drops the parent span (`trace.deleteSpan`) while preserving baggage, so every incoming request roots its own trace and the ratio sampler applies uniformly. `remoteParentSampled` is also set to the ratio sampler as a belt-and-suspenders fallback, in case an inbound sampled parent ever reaches the sampler another way. Two effects: the divisor becomes effective on the API server, and the API no longer stitches onto (and inflates) the propagated task-run traces, which is where the very large, un-thinnable trace chains came from. Rooting each request removes those chains rather than only diluting them. Only the internal APM trace pipeline (`INTERNAL_OTEL_TRACE_EXPORTER_URL`) is affected. The user-facing run-trace pipeline (`otel.v1.traces` -> ClickHouse) is a separate path and is untouched. The only consumer of the global propagator's `extract` is the OTel HTTP/Express auto-instrumentation, so the blast radius is inbound-request trace shape. ## Evidence (local full-stack red/green, divisor 10) A local OTLP/JSON sink counting spans; a driver fires N requests at a real endpoint, each carrying a distinct sampled `traceparent`, then counts how many spans/traces carry that run's marker. | run | code | sent | kept traces | kept fraction | | --- | --- | --- | --- | --- | | before | unmodified | 500 | 500 | 1.00 | | after | this PR | 500 | 67 | 0.134 | | after | this PR | 2000 | 213 | 0.1065 | Before: 100% of inherited-sampled requests kept, divisor ignored. After: ~10% kept (the divisor), converging on it at larger N. In every after-run each kept request is a single self-rooted trace (kept spans == kept distinct traces), confirming the inherited chains are gone, not just thinned. `typecheck` passes. ## Rollout / rollback No flag. Behavior stays governed by the existing `INTERNAL_OTEL_TRACE_SAMPLING_RATE`. Rollback is a straight revert with no data migration. ## Notes Internal dashboards that count raw span or request volume from this pipeline will read lower once this ships. That is expected: those counts were inflated by the bypass, not a real drop in traffic. Latency/percentile monitors retain plenty of samples at the current divisor. refs TRI-13031 |
||
|
Iss
|
98cdf89c4f |
chore: vouch NERLOE (#4531)
Adds [NERLOE](https://github.com/NERLOE ) to the list of vouched outside contributors so their PRs aren't auto-closed by the vouch check. |
||
|
github-actions[bot]
|
72f50c2dad |
chore: release v4.5.10 (#4440)
🚀 Publish Trigger.dev Docker / typecheck (push) Failing after 0s
🚀 Publish Trigger.dev Docker / units (push) Failing after 0s
🚀 Publish Trigger.dev Docker / publish-webapp (push) Has been skipped
🚀 Publish Trigger.dev Docker / publish-worker-v4 (push) Has been skipped
🚀 Publish Trigger.dev Docker / scan-webapp (push) Has been skipped
🚀 Publish Trigger.dev Docker / scan-supervisor (push) Has been skipped
🧭 Helm Chart Release / lint-and-test (push) Has been cancelled
🚀 Publish Trigger.dev Docker / 📣 Dispatch main image (push) Has been cancelled
🧭 Helm Chart Release / release (push) Has been cancelled
|