## Summary

Replace mouse-only dashboard actions with native buttons.

Copy, remove, and stop-generation controls now expose keyboard focus and
accessible names. Hover-revealed actions remain mounted so keyboard
users can discover them, and a decorative clipboard icon no longer
captures clicks.

Base: [#4697](https://github.com/triggerdotdev/trigger.dev/pull/4697)
## Summary

Use native label and checkbox behavior for `CheckboxWithLabel` and
enforce `jsx-a11y/no-noninteractive-element-interactions`.

The component no longer simulates checkbox activation with click
handlers on non-interactive wrappers. Native change events now drive the
controlled checked state.

Base: [#4696](https://github.com/triggerdotdev/trigger.dev/pull/4696)
## Summary

Require accessible names for dashboard controls.

Filter menu action items and chart color controls now expose explicit
names. The chart legend action uses a native button, while lint depth
and spacer-cell configuration match the rendered control structure.

Base: [#4695](https://github.com/triggerdotdev/trigger.dev/pull/4695)
## Summary

Add explicit types to native dashboard buttons and enforce
`react/button-has-type`.

This prevents action buttons from accidentally submitting a surrounding
form. Shared button primitives retain their caller-selected submit and
reset semantics with documented lint exceptions.

Base: [#4691](https://github.com/triggerdotdev/trigger.dev/pull/4691)
## Summary

Remove redundant React fragments from the dashboard and enforce
`react/jsx-no-useless-fragment`.

The cleanup returns existing nodes, arrays, and empty states directly
without adding wrapper elements.

Base: [#4689](https://github.com/triggerdotdev/trigger.dev/pull/4689)
## Summary

Keep component and renderer identities stable across dashboard renders.

Inline icon components, chart renderers, table cells, and select render
callbacks now use module-level implementations. Oxlint enforces the
pattern across the dashboard.

Base: [#4688](https://github.com/triggerdotdev/trigger.dev/pull/4688)
## Summary

Enforce stable React hook ordering in the dashboard and React hooks
package.

Conditional hook calls now keep a consistent order, and overloaded
realtime stream arguments are resolved before entering the shared hook
implementation.

Base: `main`
## Summary

Memoize shared context values so provider renders do not unnecessarily
rerender every consumer. Oxlint now enforces this pattern for the rest
of the dashboard.

Base: [#4677](https://github.com/triggerdotdev/trigger.dev/pull/4677)
## Summary

Enable small cleanup rules for redundant boolean expressions, object
ownership checks, assignments, and object construction.

The existing call sites now use the simpler equivalent forms, keeping
future code consistent without changing behavior.

Base: [#4672](https://github.com/triggerdotdev/trigger.dev/pull/4672)
## Summary

Enable additional lint rules that catch unsafe optional-chain
assertions, inherited-property iteration, anonymous symbols, and unsafe
external links.

The existing violations now use explicit values and own-property checks,
so the rules can prevent those patterns from returning.
## Summary

The server half of hosted webhooks: the public ingress endpoint,
signature verification, the delivery pipeline (Postgres partitioned
storage + ClickHouse for ordering), the in-app partition manager, the
HTTP API, and the dashboard (Deliveries, Endpoints, and the in-app test
console).

The public SDK and docs half is #4537. That PR carries the user-facing
API (`webhook()`, `chat.event` / `chat.channels`, the
`@trigger.dev/slack` connector) and builds on the shared
`@trigger.dev/core` schemas that ship here.

## Shipping behind a flag

A `WEBHOOK_ENABLED` env var (default off) gates the public ingress route
and the engine worker plus partition cron, so merging and deploying this
changes nothing in production until it is flipped on per environment.
The dashboard is separately gated per org by the `hasWebhooksAccess`
feature flag.

## Note on packages

This PR includes the `@trigger.dev/core` schema additions the server
compiles against, but carries no changeset. Core is not consumed
independently of the SDK, so it is released together with the SDK via
#4537. Keeping its changeset off `main` means no release cut from `main`
publishes it early.
## What & why

Org avatars disappeared from the sidebar, replaced by alt text spilling
across it. Two bugs stacked: the document img-src CSP pins the Google
favicon endpoint org avatars are stored as, but Google 302-redirects it
to `tN.gstatic.com` and CSP re-checks the redirect target, so the avatar
is refused. Changelog images served from `trigger.dev` in the agent chat
were also missing from the allowlist. And `Avatar.tsx` had no clipping
and no error fallback, so a refused image degraded into overflowing alt
text.

## What's inside

**CSP allowlist** — `app/utils/cspImageOrigins.ts`: the base sources
gain the four gstatic shards `t0`–`t3.gstatic.com`, path-pinned to
`/faviconV2`, plus `https://trigger.dev/changelog/` as a path prefix. No
wildcards — the no-wildcard beacon policy stands. The shard hosts are
Google-operated with no public write path, so the enumeration is as
narrow as the existing `s2/favicons` entry; if Google ever adds a `t4`,
the failure mode is one broken avatar, not a broken page.

**Avatar fallback** — `app/components/primitives/Avatar.tsx`: the image
box clips, and a failed load falls back to the globe icon. That covers
failures before hydration too — `onError` never replays for a node that
already failed, so a ref checks `complete && naturalWidth === 0` at
attach time. The error state resets when the URL changes
(`key={avatar.url}`).

**Radio card theming** — `app/components/primitives/RadioButton.tsx`: in
the dark themes the checked radio card rendered darker than the
unchecked ones. Unchecked cards now sit on `background-bright`
(near-black in dark, unchanged white in light) and the checked card uses
the `surface-control` tokens, so selection reads black → grey in dark
themes; light theme keeps its current look. The API keys route keeps its
indigo checked-hover via an explicit override.

## Testing

The CSP test helper now implements CSP's real path-matching rule
(trailing slash = prefix, otherwise exact, query ignored) and asserts
the pins hold: the gstatic redirect target passes, `beacon.png` on
gstatic, a `t9` shard, and non-changelog `trigger.dev` paths stay
blocked. 39 tests green plus webapp typecheck. Verified against a
running webapp that the served directive contains the new sources.
Stacked on #4418. Merge that first.

The UI slice of the dashboard agent: the side panel, the chat transport
wiring, message and card rendering, suggested prompts, and chat history.
#4418 works without this — the system is simply invisible. The diff is
mostly components, so the notes below cover only the three decisions you
can't read off the markup. Behavior and a hands-on walkthrough live in
GUIDEBOOK.md, which lands with #4525.

## Decisions worth knowing

- **Action rows always render at the end of a turn.** The model's
emission order isn't trusted for layout, so action blocks are split out
of the stream and appended last. Display only — `answered` stays keyed
on the emission index.
- **The last-chat memory is org-true.** It's keyed by the chat's own
organization, and a foreign or deleted chat comes back as a 404 the
client treats as gone, rather than an empty chat it keeps around.
- **A dead stream self-heals from the settled transcript.** Terminal
records are written to the chat row after the client's stream closes, so
the panel re-reads it. The poll gate is any unfinished turn — a dangling
tool part, not just an open investigation.

## Notes

- Gated by `canAccessDashboardAgent`; no behavior change with the flag
off.
- Page marks: `handle.agentPageContext` on 47 routes, ~20 lines each.
- Entry points: Ask Trigger button, ⌘J, Help & Feedback. The old ⌘I and
`?aiHelp=` links keep working.

## Screenshots

<img width="1440" height="788" alt="Screenshot 2026-08-07 at 15 14 29"
src="https://github.com/user-attachments/assets/f4e89e8d-13ed-4be3-a88d-d5cca3ece0fa"
/>
## What & why

This is the system behind the Dashboard Agent — an assistant that
answers questions about a project's runs, errors, queues, deploys and
health, and can investigate failures end to end.

The agent runs as a chat.agent task in its own Trigger project. It has
no access to the main database or ClickHouse; all platform data is read
through the public API using a delegated, read-only user token.

Everything here is behind `canAccessDashboardAgent` and inert with the
flag off. The UI that mounts the panel lands in #4529.

## Stack

`#4418` (this, base) ← `#4529` UI ← `#4525` Watch ← `#4516` storybook
gallery. The scenario/contract reference for the whole stack is
`internal-packages/dashboard-agent/GUIDEBOOK.md` (it lands on the Watch
branch): it states, per feature, what makes each thing happen and where
that is decided.

## What's inside

**Agent runtime and tools** — `internal-packages/dashboard-agent`:
prompt, tool set (API reads, TRQL query, docs, navigation,
evidence/investigations, repo source), conversation compaction, a
prompt-prefix token budget pinned by snapshot test, and sampled
LLM-judged turn evals. The package cannot import webapp server code,
which is what makes the "no DB access" claim structural rather than a
convention.

**Contracts** — `internal-packages/dashboard-agent-contracts`:
`trigger://` URIs, intents, and the block envelope every rendered card
travels in.

**Conversation store** — `internal-packages/dashboard-agent-db`: drizzle
over postgres-js in its own `trigger_dashboard_agent` Postgres schema,
plus one additive migration.

**Auth boundary** — the user-actor token gains an optional environment
claim; one guard (`userActorEnvironment.server.ts`) enforces it so
routes don't each re-derive the rule. Token minting, cap ceiling, and
the RBAC fallback path for self-hosted.

**Transport** — webapp resource routes that mint the token and proxy
each turn, and SDK-side mid-turn reconnect.

**Public API the agent reads through** — orgs, projects, environments,
runs, queue metrics, workers, a run's commit metadata, repo snapshot,
reports, and `POST /api/v1/query`.

**Reports** — the health report's layout is declared once and shared by
the card, the markdown surface and the JSON/MCP surface, so the same
report reads the same in the dashboard, the terminal and an editor.

**Block renderers** — the report and investigation cards the flows above
already emit (`app/components/dashboard-agent/`). The panel that hosts
them, and the rest of the chat UI, is #4529.

**Query safety and CSP** — see below.

## Key decisions

- **The agent is a separate Trigger project, not webapp code.** It reads
platform data over the public API with a delegated user-actor token
whose `cap` ceilings it to read scopes. No Prisma, no ClickHouse, no
webapp imports.
- **The PAT-only auth helper now refuses user-actor tokens.** This is an
intentional behavioral change: its callers consume only a bare userId
and do not enforce delegated-token capabilities. Actor-aware routes
continue through the scoped route builders instead.
- **RBAC fallback builds a delegated token's ability from its own cap**,
never the blanket ability a PAT gets (read-only when the token declares
none). Without this, the agent's read-only cap would buy a write JWT on
self-hosted.
- **Org creation checks RBAC only for user-actor tokens, and only after
the env gate**, so an install with `ORG_CREATION_API_ENABLED` off
returns 404 rather than 403, and an ordinary PAT never consults an
ability the route has no org to scope. Both orderings are pinned by
test.
- **The query path is read-only in depth.** TRQL rejects write
statements at the grammar level (they don't parse, rather than being
filtered), ClickHouse runs with `readonly=1`, and the org/project/env
filters are injected server-side from the credential — the request body
cannot widen scope. An unparseable query denies instead of falling
through to the permissive resource.
- **Document-wide img-src CSP.** Remote images are an
outbound-request/exfiltration surface, so the policy permits only
own-origin/data/blob, the required SSO avatar hosts, and the favicon
endpoint. Operators can add exact origins through CSP_IMG_SRC_ALLOWLIST;
wildcard hosts and bare schemes are intentionally not allowed.
- **The chat transport reconnects on a mid-turn EOF**
(`@trigger.dev/sdk`). A body that ends without a turn-complete is
terminal only when the server says `X-Session-Settled: true`; otherwise
the transport resubscribes from `lastEventId` with bounded backoff, and
any record re-earns the budget. Previously a closed long-poll window or
a proxy restart left the reply stuck as if still generating.
- **Conversations live in their own datastore**, schema-scoped and
foreign-key-free (it references `organizationId`/`userId` by id, because
in cloud it is a different database). It is a display read-model for the
History tab and transport resume; `chat.agent`'s object-store snapshot
remains the model's source of truth.
- **Deterministic first.** Reports and health checks contain no LLM —
they are computed from the same data the dashboard shows, and the model
only narrates and links them. That is what makes a number in an answer
auditable.

## Testing

- 63 new test files, run with `pnpm run test --filter webapp` and
per-package vitest. Heaviest coverage on the auth boundary
(`userActorPatOnlyBoundary`, `userActorTokenClaimsAndScopes`,
`contextlessPatRoutes`, `rbacFallbackBranch`), TRQL read-only, the
report layout, and the SDK reconnect.
- The agent package has a separate eval lane (`pnpm run test:evals`,
`vitest.eval.config.ts`) that hits the real model, so it never runs in
`pnpm test`.
- Live-tested against a local stack scenario by scenario; the GUIDEBOOK
lists the condition each behaviour is expected under, which is what
those runs were checked against.

## Changelog

`.server-changes/dashboard-agent.md`, plus changesets for
`@trigger.dev/core` (report schemas), `@trigger.dev/sdk` (chat
reconnect) and the CLI's `mint-token` help text.
Adds System Preferences, Dark and Light themes, gated by the
`hasThemeSwitcher` feature flag (off by default — dark stays the default
theme for everyone).

Old theme is now "Classic"and set as default.
"System preferences" theme has both Light and Dark modes and uses your
laptop settings to use a correct one.
It has less color accents (specifically less colored text), and they are
the same for both modes, only grayscale values change between them. And
Light/Dark themes can be used separately.

New Contrast setting is available for System Preferences, Dark and Light
themes - it changes the contrast for the whole app. All new visual
Settings live in Account.
## Summary

The task, scheduled task and agent pages now name their runs table with
its own title bar, and the controls that page the table sit beside it
rather than in the bar at the top of the page. The top bar keeps just
the date filter.

Two agent page layout bugs are fixed along the way: scrolling a wide
runs table sideways dragged the charts off screen with it, and the
details panel stopped short of the bottom of the window.

## Fix

The charts moved because the runs table had no horizontal scroller of
its own. `stickyHeader` swaps the table's `overflow-x-auto` for
`overflow-visible`, so the overflow escaped up to the page scroll box,
and setting only `overflow-y-auto` on that box leaves the computed
`overflow-x` at `visible`, which CSS then promotes to `auto`. The chart
grid is a sibling inside that box, so it scrolled too. The table now
keeps its own scroller (the same rule the queues list already documents)
and the page box clips x so this cannot recur.

The short panel was a second `PageContainer` wrapping the agent routes.
`PageContainer` is `grid-rows-[auto_1fr]`, so a lone child lands in the
`auto` row and its `h-full` resolves against content height instead of
the viewport.

This also reverts the global tooltip `max-w-[230px]` introduced in
[#4131](https://github.com/triggerdotdev/trigger.dev/pull/4131), so
longer tooltips are no longer squeezed into a narrow column.

### Agent overview page showing table now scrolling
<img width="3452" height="1648" alt="CleanShot 2026-08-01 at 12 04
38@2x"
src="https://github.com/user-attachments/assets/ef1ac55d-8ffb-4278-983b-031ed21c1f55"
/>
## Summary

Adds an admin-only "AI agent" storybook page exploring an animated
identity for the dashboard agent: a resting dot logo that animates while
the agent is thinking, then settles once it is done.

The lead experiment is a 5x5 dot matrix. Shapes are five-line string
bitmaps, a bright head walks each shape's route on a fixed beat, and it
only hands off between shapes on a dot the two share, so the rhythm
never breaks. It comes with 26 faces, six gradient palettes, and light
and dark treatments. Two earlier prototypes (a crisp logo that scatters
into orbiting dots, and a dotted triangle on tilted 3D orbits) are kept
in their own tabs for comparison. Everything is plain canvas code with
no new dependencies.

Also adds an `ask-ai` Button variant: secondary styling with a soft
trigger-green border and padding tuned around the leading logo. The
variant supplies the agent logo itself, so callers write `<Button
variant="ask-ai/small">Ask AI</Button>`. Passing a `LeadingIcon`
overrides it, which is how the thinking animation gets driven.

No release note: the storybook is admin gated and the button variant is
not used in product UI yet.
## Summary

Opening a filter sub-menu that has its own search field left the cursor
outside it, so you had to click into the field before you could type.
The cursor now lands in the search field every time a sub-menu opens.

`ComboBox` now focuses its input whenever the popover is open and the
field is present, so the cursor lands there both when a menu opens
normally and when a sub-menu mounts its field late. It is a no-op
wherever focus already worked.

Verified in the dashboard against the Tags menu: before, the field
mounted with focus still on the popover container; after, it mounts
focused and accepts typing straight away.
## Summary

Three related changes, each independently gated:

**Queue metrics and health.** Per-queue depth, throughput (enqueued,
started, completed), concurrency, whether a queue is throttled, and
scheduling delay (how long a run waits between becoming eligible and
actually starting), plus a per concurrency-key breakdown for keyed
queues. Collected from inside the run queue itself, stored in
ClickHouse, and surfaced on the Queues list, a new per-queue detail
page, the task pages, and the run inspector. The question it answers is
"does this queue have enough concurrency to keep up, and if not, which
key or which limit is the constraint".

**Percent-based queue concurrency limits.** A queue's concurrency
override can now be expressed as a percentage of the environment limit,
stored as the source of truth and re-materialized whenever the
environment limit changes. Absolute overrides above the environment
limit are now **rejected with a 400** instead of being silently capped,
which is a behavior change on `POST
/api/v1/queues/:queue/concurrency/override`.

**The `health` report.** A server-computed verdict on whether work is
flowing, whether the runs that do start are healthy, and whether
telemetry is fresh, rendered as text with sparklines. Available as `GET
/api/v1/reports/:key`, `trigger report`, and the `get_report` MCP tool
(plus a `report` MCP prompt, which shows up as a slash command in hosts
that support prompts).

With the flags off, the Queues page renders the pre-metrics component
verbatim, nothing is emitted, and nothing is written to ClickHouse.

## Configuration

Two independent gates, on purpose. Emission is global so data accrues
for everyone before anyone can look at it; the view is per organization
so it can be turned on for one org at a time without a deploy.

**Runtime flags (no restart)**

| Flag | Store | Gates |
| --- | --- | --- |
| `queue_metrics:enabled` | run-queue Redis key (`"1"`/`"0"`, off by
default) | All emission, gauges and counters. Cached in-process for 10s
with stale-while-revalidate, warmed eagerly at boot so the first op
after a deploy is not dropped. |
| `queue_metrics:gauge_sample_rate` | run-queue Redis key, `0..1` |
Fraction of queue ops that emit a gauge. Counters are never sampled, so
throughput stays exact at any rate. |
| `queueMetricsUiEnabled` | feature-flag catalog: global `FeatureFlag`
row, per-org `Organization.featureFlags` override wins | Whether an org
sees the metrics view at all: the Queues list variant, the queue detail
route, the built-in Queues dashboard, the concurrency-keys endpoint, and
the metrics blocks on task pages and the run inspector. Off by default;
a gated org gets a 404 on the detail route rather than an empty page. |

Both Redis keys are readable and writable from `/admin/queue-metrics`
(super-admin UI, with a live per-shard stream-health table) and
`GET`/`POST /admin/api/v1/queue-metrics` (admin PAT). The admin surface
uses its own Redis client, so it works on any instance regardless of
whether that instance runs the emitter or the consumer.

**Environment variables (boot time)**

| Variable | Default | Notes |
| --- | --- | --- |
| `QUEUE_METRICS_EMIT_ENABLED` | `0` | Constructs the emitter and
injects it into the run engine. Without it the run queue has no emitter
at all. |
| `QUEUE_METRICS_CONSUMER_ENABLED` | `0` | Boots the stream consumer on
this instance. Independent of emission, so consumers can be sized
separately from the API. |
| `QUEUE_METRICS_STREAM_SHARD_COUNT` | `4` | Stream shards, hashed per
queue. |
| `QUEUE_METRICS_CONSUMER_BATCH_SIZE` | `1000` | Poll batch equals
insert batch, so an ack can never outrun a write. |
| `QUEUE_METRICS_REDIS_{HOST,PORT,USERNAME,PASSWORD,TLS_DISABLED}` |
falls back to the run-queue Redis | Set `HOST` to move the metrics
stream onto a dedicated instance so a metrics backlog cannot compete
with the run queue for memory. Self-hosters can leave it unset and get a
single-Redis deployment. |
| `QUEUE_METRICS_COUNTER_STREAM_MAXLEN` | `2000000` shared, `8000000`
dedicated | Bound on how much a stalled consumer can hold. The default
is deliberately lower when the stream shares the queue-critical Redis. |
| `QUEUE_METRICS_COUNTER_ODOMETER_TTL_SECONDS` | `604800` | TTL on the
per-queue cumulative counter key, refreshed on every write, so only
queues idle for the whole window are purged. |
| `QUEUE_METRICS_MAX_QUEUE_NAMES_PER_ENV` | `1000` | Distinct queue
names tracked per environment; overflow collapses into `__overflow__`. |
| `QUEUE_METRICS_MAX_CONCURRENCY_KEYS_PER_QUEUE` | `10000` | Same idea
one level down, per queue. |
| `QUEUE_METRICS_GAUGE_SAMPLE_RATE` | `1` | Default for the live
sample-rate key above. |
| `QUEUE_METRICS_QUERY_TABLES_VISIBLE` | `0` | Lists the queue-metrics
tables in the Query page, its schema docs, the schema API and the AI
query context. Off keeps them unlisted while the feature is dark; a
query naming them still runs either way. |
| `QUEUE_METRICS_CLICKHOUSE_URL` | falls back to the shared wiring |
Runs queue metrics on their own ClickHouse service: the consumer's
inserts and every queue-metrics read go through it, so a metrics-heavy
chart refresh never competes with runs-list or trace reads. Unset
reproduces the previous split exactly (inserts on `CLICKHOUSE_URL`,
reads on the query pool). |
| `QUEUE_METRICS_CLICKHOUSE_READER_URL` | the write URL | Reader split,
so the consumer's inserts can never land on a read endpoint. |
|
`QUEUE_METRICS_CLICKHOUSE_{KEEP_ALIVE_ENABLED,KEEP_ALIVE_IDLE_SOCKET_TTL_MS,MAX_OPEN_CONNECTIONS,LOG_LEVEL,COMPRESSION_REQUEST}`
| `1`, unset, `10`, `info`, `1` | Pool tuning, matching the other
per-workload ClickHouse clients. |

Migrations to apply: ClickHouse `036_create_queue_metrics_v1.sql`, and a
Postgres migration adding the nullable
`TaskQueue.concurrencyLimitOverridePercent`. Both are additive.

## How collection works

Queue operations produce two kinds of signal, and they have opposite
failure modes, so they are handled differently.

**Gauges** (queued, running, queue limit, env queued, env running, env
limit, throttled, plus keys-with-backlog and worst-key wait on keyed
queues) are read *inside* the same Redis script that performs the
enqueue or dequeue, so the reading is atomic with the operation it
describes rather than a racy follow-up read. The script returns them on
its reply and the app forwards them to the stream. Gauges are sampled
and drop-tolerant: they are aggregated with `max`, so a lost reading
costs resolution, never correctness.

**Counters** (enqueued, started, completed, plus nack and dead-lettered)
are cumulative odometers. Each event increments a per-queue key on the
metrics Redis and emits the absolute total, and ClickHouse takes the
difference across buckets at read time. This is the important property
of the design: a summed-delta counter undercounts permanently on any
lost event, while a cumulative one self-heals, because the next
surviving reading restates the whole total. Only bucket granularity can
be lost, never the total. A queue returning after its odometer TTL
expired restarts at 1 and reset detection handles it, which is safe
precisely because expiry only spans a window with no activity.

Both land on one sharded Redis stream. A consumer reads it with a
consumer group, reclaims stale pending entries on a 15s interval rather
than on every poll, maps one entry to one or two ClickHouse rows
(whole-queue and, for keyed queues, per-key), and acks only after the
insert lands. Each batch carries a dedup token derived from its
stream-entry ids, and the target tables set
`non_replicated_deduplication_window`, so a retried batch cannot
double-count either the raw rows or the aggregates that hang off them.
Consumer and emitter both emit OTel metrics
(`queue_metrics.emitter.emitted`,
`queue_metrics.consumer.{entries,rows_inserted,insert_errors,insert_duration,stream_depth,group_lag,pending,lag_unknown}`);
stream depth and group lag are the two worth alerting on, and
`lag_unknown` exists because Redis can report a null lag after a trim,
which must not be read as zero.

## Storage and read path

`queue_metrics_raw_v1` is a short landing table with a 6 hour TTL. Four
aggregate tiers are materialized straight from raw, never cascaded off
each other, each with a 30 day TTL:

- `queue_metrics_v1`, 10 second buckets per queue, the default read path
- `queue_metrics_5m_v1`, 5 minute buckets per queue, for wide ranges and
cross-queue ranking
- `env_metrics_v1`, 10 second buckets per environment, queue-independent
so it stays cheap at any range
- `queue_metrics_ck_v1`, 10 second buckets per concurrency key

Every tier is an MV from raw because the counter states do not survive a
cascade: their merge is order sensitive, so a `-MergeState` chain off
the 10s table inflates the result, and the same property means an
aggregate state may only be merged inside one queue. That constraint is
now enforced by the query engine rather than by reviewer discipline: a
column can declare a `mergeGroupKey`, and any query that references it
without grouping by, or pinning to a single value of, every named key
fails to compile with an actionable message.

On the read side, TRQL gains three tables (`queue_metrics`,
`env_metrics`, and a `queue_metrics_by_key` that is hidden from the
editor, schema docs and schema API but still queryable, so per-key rows
can never silently merge into a plain per-queue query), plus
`deltaSumTimestampMerge` and `quantilesTDigestMerge`. Two schema-level
optimizations ride along: a table can declare coarser rollups, so a
query whose bucket interval is 5 minutes or wider is routed to the 5m
table with no change to the query itself, and it can opt into the
ClickHouse query cache with time bounds floored to a fixed grid, so the
auto-refreshing dashboards actually share cache entries instead of
missing on every tick. Both are caller-side substitutions, so the
printer stays unaware of physical layout.

All of this can also live on its own ClickHouse service. A table
declares the pool its reads run on, the three queue-metrics tables name
the dedicated one, and the ingestion consumer writes through the same
client, so both directions move together with one env var and nothing
else routes differently.

The other engine change is opt-in gap filling: charts can request rows
for empty buckets, where counters zero-fill and gauges carry forward.
Grouped gauge series are densified per group and carried inside a
partition, so a quiet queue's line holds its last value without bleeding
another queue's value into it.

## Queue concurrency limits

`concurrencyLimitOverridePercent` on `TaskQueue` is the source of truth
when an override is set as a percentage; the absolute `concurrencyLimit`
is materialized from it (floored, clamped to at least 1 so a percentage
can never act as a pause, and never above the environment limit). Every
path that changes an environment limit now recalculates the
environment's percent-based overrides afterwards, outside the
transaction, and pushes changed limits to the engine. The push is
attempted even when the stored value did not change, so a previously
failed sync self-heals rather than leaving the database and the engine
diverged; paused queues are skipped so a recalculation cannot
effectively unpause one.

The API accepts exactly one of `concurrencyLimit` or `percent`, and the
reject-instead-of-clamp change above means a request asking for more
than the environment allows now fails loudly. The percent bound (greater
than 0, at most 100) is defined once and shared by the zod schema, the
dashboard mutation handler and the service, so the three cannot drift.

The concurrency-keys table on a queue is now paginated against the
ClickHouse per-key tier, ranked by peak backlog with the total on every
row from a single scan, and only the keys on the current page are
enriched with live counts from Redis. That replaces a hard top-50 cap
with something whose cost is a function of page size rather than key
cardinality.

## The health report

`GET /api/v1/reports/:key?period=&format=markdown|ansi|json`. The
verdict is computed on the server and is deterministic, not
model-generated. Three independent analyzers run over one input
snapshot: flow (is work moving, and if not, is the cause a limit,
throttling, one bad queue, or dead-lettering), execution (are the runs
that start succeeding, and at what latency), and liveness (how fresh is
the telemetry). When telemetry is genuinely stale, the first two are
forced to unknown and every actionable field is stripped, so no surface
ever advises action off stale data.

Authorization is per query table rather than a blanket query grant: a
JWT must be scoped to every table the report reads (`runs`,
`env_metrics`, `queue_metrics`), so a narrowly scoped token cannot pull
a report that reads more than it was granted. `period` is validated as a
shorthand with a 90 day ceiling at the edge. The report catalog is a
registry of `{ load, interpret }` entries, so the next report is a new
entry and no change to the route, the view model, the renderers, the CLI
or the MCP tool.

`trigger mcp` no longer launches the install wizard when stdout is a
TTY, which fixed a real failure: hosts spawn the server over a PTY, so
the wizard would open and the client would time out waiting for a server
that never started. The wizard now needs `trigger mcp --install`.

## The part that is live regardless of every flag

The enqueue and dequeue scripts now return a 2-tuple so a gauge reading
can ride back on the reply. Every return site in the eight affected
scripts is wrapped, and a `nil` original is converted to `false` on the
way out, because a raw `nil` in the first slot would make Lua truncate
the multi-bulk reply and silently drop the gauge on the throttled and
empty-queue paths. The reply shape and the destructuring on the app side
are exercised on every queue operation whether or not metrics are
enabled, so that is the part of `run-engine` worth the closest review.

One behavior fix in the same area: the scheduling-delay anchor is set
only on a run's first entry into the queue. Anchoring it to trigger time
on re-enqueues made waitpoint and checkpoint resumes report the entire
wait as scheduling delay. Queue ordering is untouched, so a re-enqueued
run keeps its position, and nacks deliberately keep the original anchor
because a rolled-back dequeue is the same continuous wait.

A pending-version promotion still anchors to trigger time, on purpose:
that promotion is the run's first real entry into the queue, since the
trigger deliberately held it back waiting for a worker version, and the
TTL is armed at the same point for the same reason. The consequence is
worth naming, because it is a judgement call: a run that waits on a
deployment reports that wait as scheduling delay on its queue, which is
time unrelated to queue capacity.

## Verification

Unit and integration suites across the new package, the run queue, the
mapping layer, the query engine and ClickHouse (including a test that
applies migration 036 through the same splitter CI uses, and a
regression test that inserts the same batch three times to prove the
aggregates do not inflate). Beyond that, the whole path was driven end
to end against a live stack with real runs: emitter to Redis stream to
consumer to ClickHouse to the dashboards, for both the local dev path
and the deployed path where a supervisor drives the dequeue, with
assertions on exact counter reconstruction per queue and per concurrency
key, throttling, environment saturation, scheduling delay, and a
deliberate mid-stream reading drop to confirm the cumulative counters
still reconstruct the correct total. The gated-off state was checked on
every touched surface.

The dedicated ClickHouse service was verified against a second,
separately-schema'd instance: with it configured, the driven counters
reconstruct exactly on the dedicated instance, the shared instance gains
no rows for that window, a read through the query API returns the value
that exists only on the dedicated instance, and a `runs` query still
succeeds (it would fail outright if it were mis-routed to a service
without that table). With the variable unset, the full suite passes
unchanged.

---------

Co-authored-by: Katia Bulatova <katia@trigger.dev>
Co-authored-by: Katia Bulatova <katherine.bulatova@gmail.com>
Co-authored-by: James Ritchie <james@trigger.dev>
Long organization, project, and environment names in the side menu were
cut off mid-character. They now fade out at the right edge like the rest
of the side menu items already did.

### Example of faded long names:
<img width="246" height="200" alt="CleanShot 2026-07-28 at 22 59 24"
src="https://github.com/user-attachments/assets/efa60b87-286f-4ab0-9d4e-490ef2de53e5"
/>
## Summary

The project Integrations page now uses the same settings layout as the
org SSO page: a centered column of titled rows with dividers, instead of
headings over bordered boxes. GitHub, Vercel and build settings read as
one consistent list, and the page titles itself "Integrations".

Confirmations persist rather than vanishing once you move past them
(`GitHub app: Installed`, `Vercel project: Connected`), plan-gated rows
offer an Upgrade button instead of a dead toggle, a disabled toggle
explains why in place and highlights the control that unlocks it, and
warnings are rows with a hazard icon and their recovery action on the
right. Copy throughout leads with the outcome instead of restating the
field label.

Two fixes along the way: a nested `<form>` in the Vercel panel that
failed hydration and silently truncated the page, and every settings row
carrying a few pixels more space above its title than below its
description.

### Before
<img width="1160" height="1972" alt="CleanShot 2026-07-26 at 21 56
42@2x"
src="https://github.com/user-attachments/assets/ed0fd676-36d8-4eb7-a16e-827a24f007d9"
/>


### After
<img width="1358" height="4455" alt="CleanShot 2026-07-26 at 19 14
28@2x"
src="https://github.com/user-attachments/assets/6a635e6a-c0eb-4a4c-a68f-fcde4d25e8a6"
/>
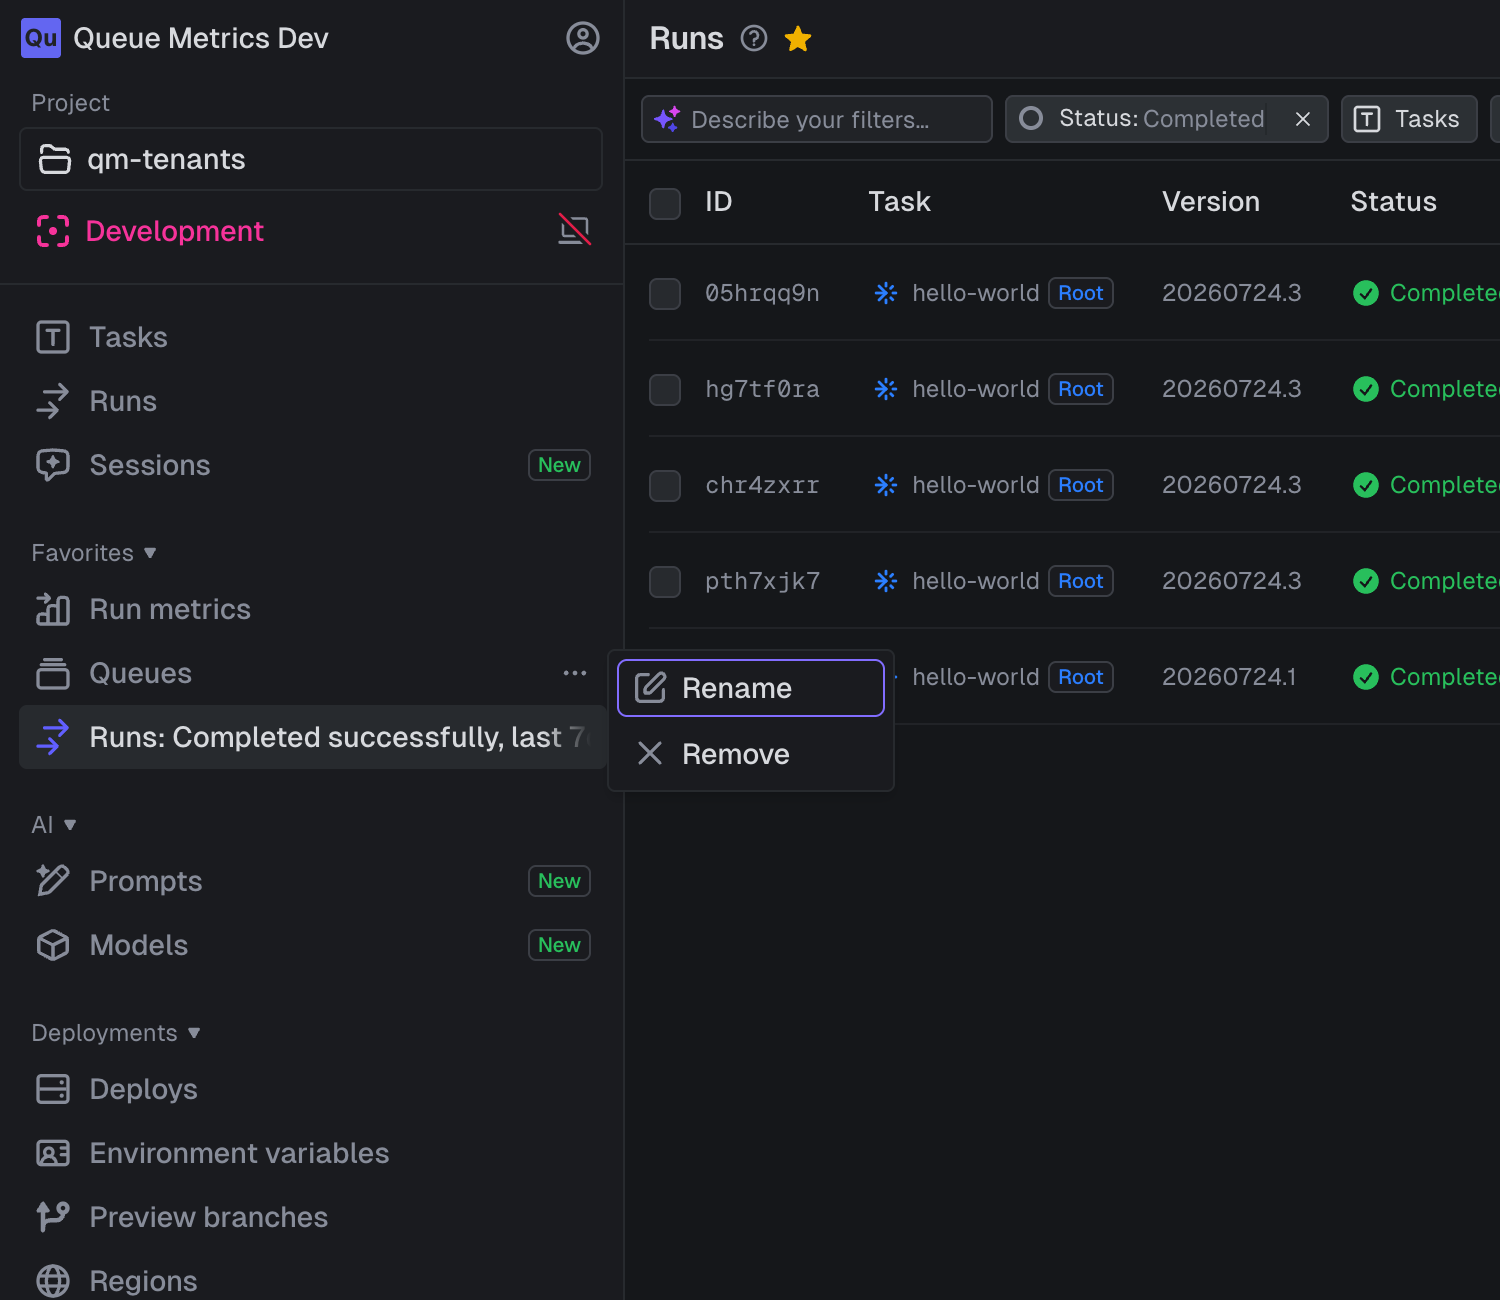
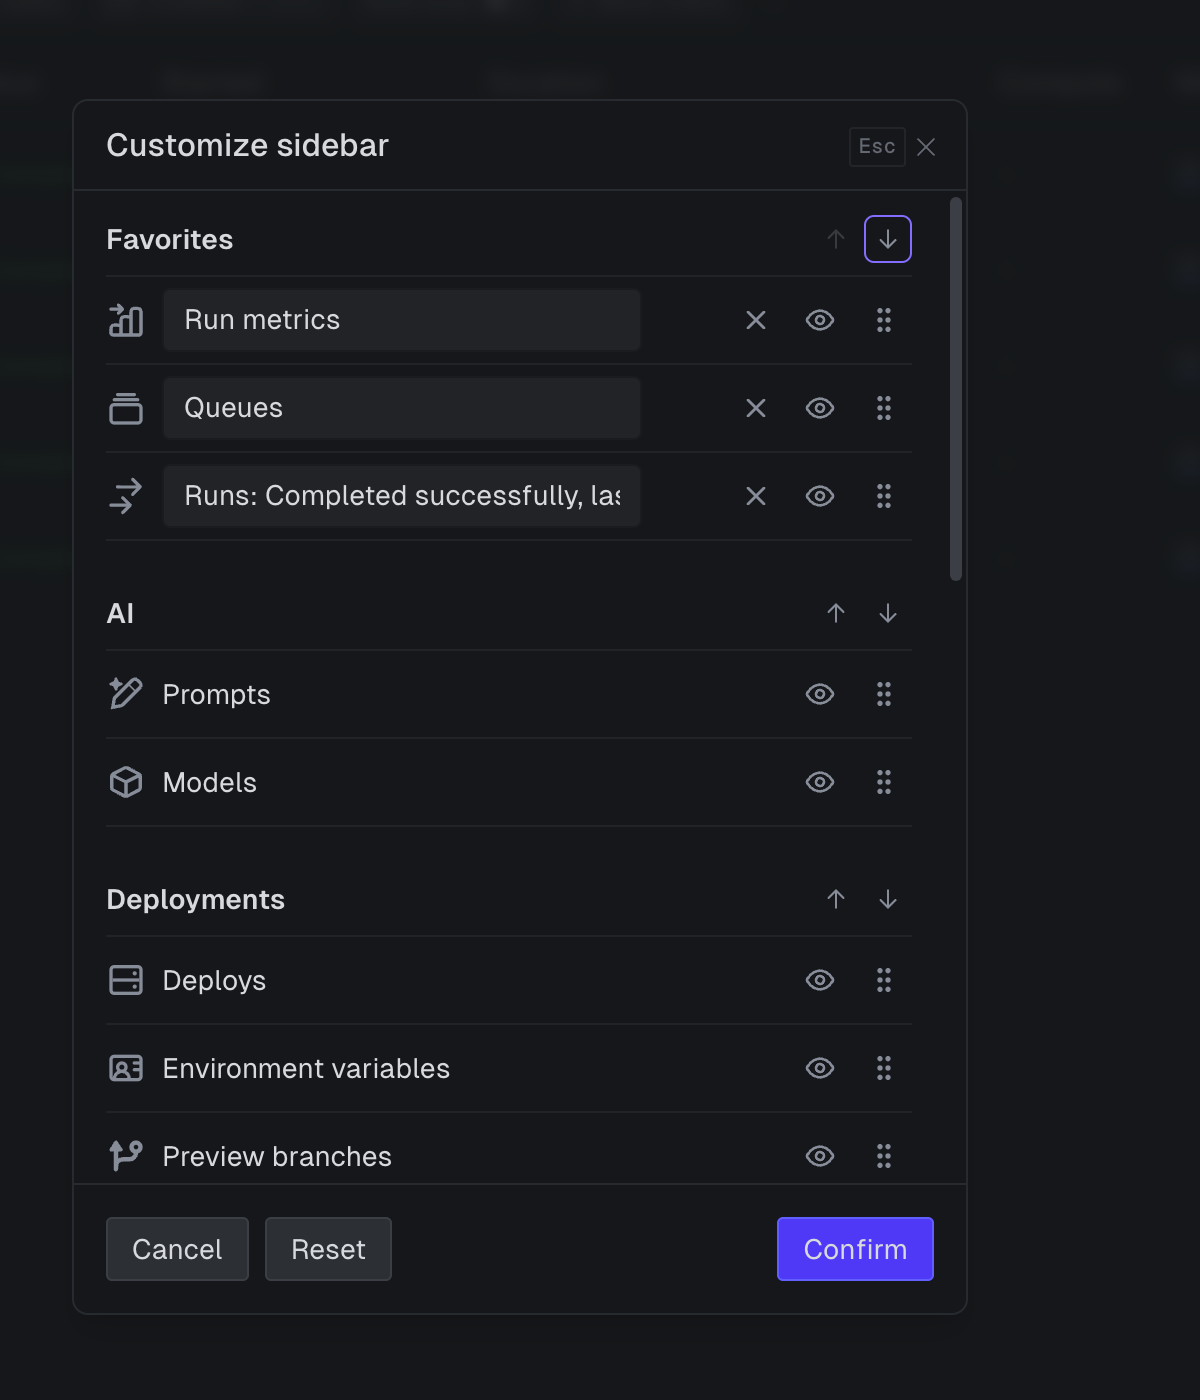
## Summary
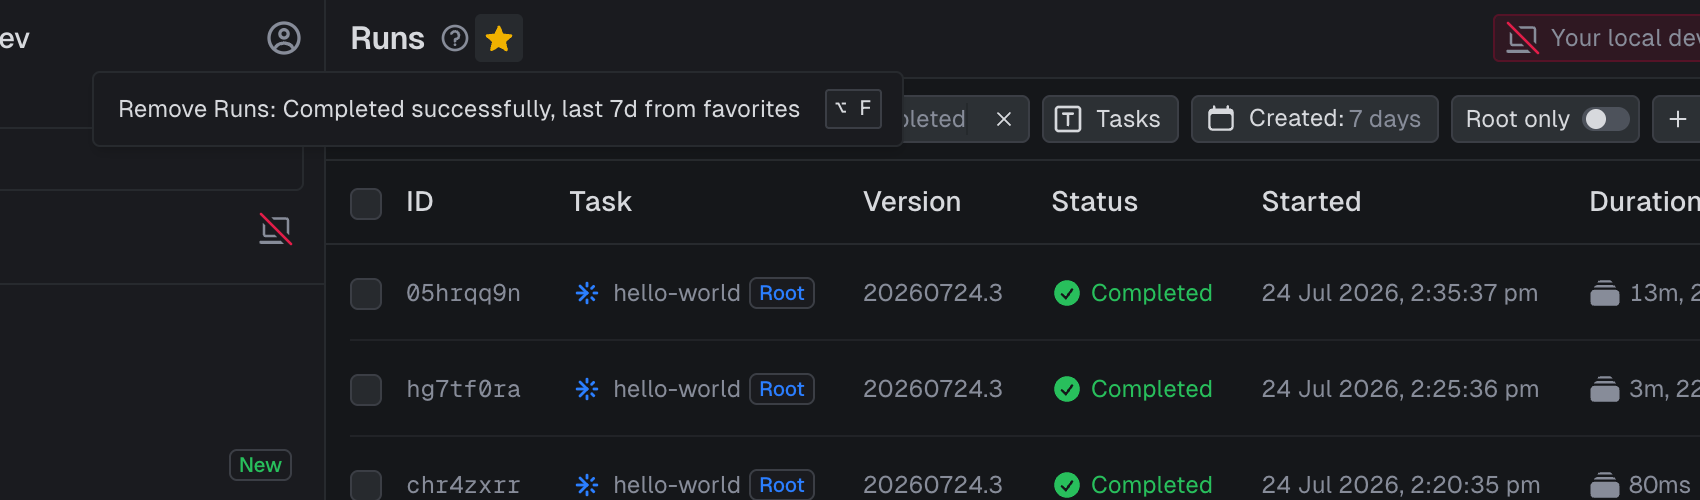
Favorite any dashboard page and it appears in a new "Favorites" section
at the top of the side menu. The star next to the page title (or
Option+F) saves the exact view, filters and tabs included, with a name
derived from the URL ("Runs: Completed successfully, last 7d", "Run:
05hrqq9n") that you can rename inline from each item's hover menu.
The sidebar is customizable too: "Customize sidebar" (on section header
menus and in each "More" menu) opens a modal where you can reorder
sections, drag items into a new order, hide items behind a per-section
"More" popover, and rename or remove favorites. Changes apply on
Confirm, Reset restores the default layout without touching favorites,
and everything is stored per user in dashboard preferences.
## Screenshots
| Favorites in the side menu | Customize sidebar modal |
| --- | --- |
| 
| 
|
## Design notes
- Favorite links carry a small marker search param so the favorite, not
its identical main menu item, highlights as active. Markers from shared
or stale links are cleaned on load, and changing any filter hands the
highlight back to the regular menu item.
- Preference writes are serialized with a row lock: several writers
(debounced collapse and width saves, favorite toggles, the customize
modal) can land concurrently and would otherwise clobber each other's
read-modify-write of the JSON column.
- Option+F is matched on `event.code` with a raw listener because macOS
reports Option-modified letters as symbols, which the `event.key` based
shortcut hook can't capture.
Verified end-to-end in the browser: star toggle and shortcut, instant
section appearance, inline rename and staged modal removal, filter-aware
labels and unique active states, shared-link normalization, drag
reordering, and persistence across reloads.
Restores the debug panel on the **Tasks** and **Runs** pages, and makes
the data it shows copyable.

Admin/impersonation only — no change for regular users, so there's no
`.server-changes`

<img width="909" height="1420" alt="CleanShot 2026-07-22 at 12 05 27@2x"
src="https://github.com/user-attachments/assets/ce2da167-dc23-422f-83f3-4f4aee9ed32c"
/>
Redesign of the main side menu: separates Projects and Accounts from the
Organization menu and makes the menu resizable.
**Main changes**
- **Organization & Account menus**: the top-left is now a dedicated
organization menu (Settings, Usage, Billing, Team, SSO, integrations),
with a separate account menu beside it (Profile, PATs, Security,
Logout).
- **Project switcher**: a new Project section above the Environment
selector.
- **Resizable side menu**: drag the right edge to set a custom width
(saved per user), or click the edge to collapse/expand.
- **Environment selector**: reworked to match the Project menu,
including dev-branch handling.
- **Account Profile page**: redesigned into the Security page's
row-and-divider layout.
Preview URL: https://samejr-org-menu-update.triggerlabs.dev/https://github.com/user-attachments/assets/9b199576-6037-4ea6-9bdb-3ee15265b8c2
## Summary

v3 (the engine that ran the SDK v3 era, internally
`RunEngineVersion.V1`) is end-of-life. Following the removal of the v3
execution apps
([#4194](https://github.com/triggerdotdev/trigger.dev/pull/4194)) and
the legacy dev websocket
([#4198](https://github.com/triggerdotdev/trigger.dev/pull/4198)), this
removes the remaining v3 execution stack from the server.

Clients still on v3 (an old SDK or CLI that has not upgraded) keep
getting a clear "upgrade to v4" response. Triggers, batch triggers,
reschedules, and deploys that resolve to v3 are rejected with a graceful
4xx pointing at the migration guide, never a 5xx, so a stale client
cannot affect server health. Self-hosted instances still running v3
should stay on the 4.5.x release line until they migrate.

## What is removed

- The MarQS queue and its shared/dev queue consumers.
- The v3 socket.io namespaces (coordinator, provider, shared-queue) and
the v3 run lifecycle services (attempt, checkpoint, and batch-resume).
- The graphile-worker background job system; all live jobs already run
on `@trigger.dev/redis-worker`.
- The `DEPRECATE_V3_ENABLED` flag: v3 is now rejected unconditionally,
so the flag is gone.
- Unused v3 exports from `@trigger.dev/core` (the `v3/zodNamespace`
subpath and the legacy socket message catalogs) and the now-dead MarQS
environment variables.

## What stays

The v4 engine is untouched. The graceful v3 rejection boundary stays,
`determineEngineVersion` still detects a v3 project so it can reject it,
and the batch service plus batch-completion worker stay for current
clients. Live queue concurrency limits and metrics now read from the v4
run engine instead of MarQS, and a brand-new dev environment now
defaults to v4.


## Dependency cleanup

Removes webapp dependencies left unused by this change: `seedrandom` and
`semver` (only the removed v3 code used them) plus a set that was
already dead, their orphaned `@types` packages, and two dead files. Adds
a `knip:deps` script and a `knip.json` config so unused dependencies can
be found the same way going forward.
## Summary

UI/layout/copy pass over the org **SSO & Directory Sync** settings page
(formerly "Identity & Access"). No logic, gates, flags, or data flow
changed — server-side auth (`manage:sso`), Enterprise entitlement,
action validation, and data loading are all untouched.

- Renamed the nav item, page title, and meta from "Identity & Access" to
"SSO & Directory Sync".
- Added a reusable `SettingsLayout` component system (container,
section, header, row, block, actions) modeled on `/account/security`,
and refactored the SSO page onto it (section titles, dividers, left
title/subtitle + right action rows).
- Tightened all UI copy: concise, active voice, consistent labels, no
em-dashes.
- `Select` primitive: additive `wrap`, `popoverClassName`, and
`placement` props (all default to prior behavior) so role options show a
bright title with a wrapping description, right-aligned popover, and no
horizontal overflow.
- Removed the external-link arrow icon from buttons that open a modal;
kept it only on genuinely external actions (Contact us, Open in new
tab).
- Polished the admin portal link dialog: smaller description, tighter
spacing, `ClipboardField` with a permanent copy button, removed the
redundant Copy link button, and a provider-aware Open label (e.g. "Open
in WorkOS") derived from the link host with a safe fallback.

### SSO page UI
<img width="3568" height="2550" alt="CleanShot 2026-07-08 at 18 52
11@2x"
src="https://github.com/user-attachments/assets/009d2437-7552-4ff0-a457-64744a9fcd88"
/>

### Login with SSO and normal email test (local)


https://github.com/user-attachments/assets/b33a4ce9-c1fa-45c9-bd3c-077cb6fc9473


## Test plan

- [ ] Non-Enterprise org: SSO page shows the upsell state
- [ ] Enterprise org, non-Owner without `manage:sso`: 403
- [ ] Enterprise Owner: verify domains, configure SSO, connect
directory, JIT/default/group role selects, and enforcement toggle all
work
- [ ] Role select popovers: bright title + wrapping description,
right-aligned, no horizontal scroll
- [ ] Admin portal dialog: copy button works, "Open in WorkOS" opens the
portal in a new tab

---------

Co-authored-by: Cursor <cursoragent@cursor.com>
## Summary

Two related timezone bugs in the dashboard.

1. The date/time tooltip could show a UTC offset label that contradicted
the time it displayed. A viewer whose machine clock differs from their
saved timezone (or when a date falls in the other DST phase) would see
something like `Local (UTC +0)` next to a value that isn't at +0.
2. A user's timezone preference silently failed to save whenever their
browser reported a zone like `UTC`, `Etc/UTC`, or `Asia/Kolkata`,
leaving their timestamps stuck in a previously-saved timezone.

## Offset label

The "Local" row formatted its time using the viewer's configured
timezone but computed the `(UTC +n)` label from `new
Date().getTimezoneOffset()`, the browser's offset at the current moment.
Those are two independent sources, so they disagreed when the configured
timezone differed from the machine, and also when the displayed date was
in the opposite DST phase. The label is now derived from the same date
and timezone used to render the row (via `Intl.DateTimeFormat` with
`timeZoneName: "longOffset"`), so it always matches the displayed time.

## Preference persistence

`/resources/timezone` validated the incoming zone against
`Intl.supportedValuesOf("timeZone")`, which lists only canonical zone
ids. Browsers report zones that aren't in that list via
`resolvedOptions().timeZone`, notably `UTC` (and `Etc/UTC`,
`Asia/Kolkata`, `GMT`), so those requests returned 400 and the
preference was never stored. Validation now checks whether the runtime
can resolve the zone at all, which accepts every real zone and still
rejects invalid input.

Added unit tests for both.
Once this is merged, oxlint is at a pretty sensible baseline.

**Enable `no-unused-vars`, `typescript/consistent-type-imports`, and
`import/no-duplicates` lint rules**

Turns on three previously-disabled oxlint rules across the monorepo and
fixes all violations:

- **`no-unused-vars`** – enabled as an error with standard ignore
patterns: unused function arguments are ignored by default (`args:
"none"`), variables/caught errors/destructured array elements prefixed
with `_` are allowed, and rest siblings are permitted.
- **`typescript/consistent-type-imports`** – enforced as an error; all
type-only imports now use the `import type` syntax.
- **`import/no-duplicates`** – enforced as an error; duplicate import
statements from the same module have been merged.

The remaining commits clean up the violations found across the codebase:
removing unused variables/imports/type aliases, adding `_` prefixes to
intentionally unused bindings, fixing duplicate imports, and converting
value imports to `import type` where appropriate.
## Summary

Improves and unifies the run-activity charts by extracting a shared set
of chart primitives and adopting them on the three task landing pages
(agent, standard, scheduled), with the density and label fixes also
carried over to the dashboard and custom query charts.

Main changes a reviewer should know about:

- **Shared primitives (DRY).** New `ChartCard` (title +
maximize/fullscreen), `ChartSyncContext` (cross-chart hover + zoom
state), `useXAxisTicks` (width-aware tick selection),
`activityTimeAxis`, and `statusColors`, plus a server-side
`activitySeries.server.ts` holding `chooseBucketSeconds`, status
grouping, and the zero-fill helpers. The three task routes and both
presenters were refactored onto these, removing roughly 3x duplicated
tick logic, status-color tables, and bucket-ladder code.
- **Denser bars on short ranges.** Server-side bucketing now uses
`chooseBucketSeconds` (nice-interval ladder, ~72 target, capped at 120
buckets) instead of the hardcoded 1h/6h/1d ladder, so a 5m or 1h range
no longer collapses into a single bar.
- **Width-aware x-axis labels.** Labels are selected to fit the measured
plot width (always first + last, evenly spaced, de-duplicated by
rendered text), stay horizontal, and reflow on panel/window resize.
Y-axis values default to compact form (8K, 1.2M) in
`ChartBar`/`ChartLine`.
- **Synced hover line.** Hovering one of the agent page's three charts
draws a dashed vertical line at the same bucket on the *other* two, and
suppresses it on the hovered chart. It is opt-in via
`ChartSyncProvider`, so single-chart pages are unaffected.
- **Maximize button.** Each chart gets a fullscreen dialog toggle
(reuses the existing dashboard-widget pattern, `v` shortcut while
hovered).
- **Drag-to-zoom on task pages.** Dragging across a task chart sets the
Time/Date filter (`from`/`to` URL params, clearing `period`/`cursor`),
with a From/To tooltip shown during the drag.
- **Custom query charts.** Long categorical x labels (run IDs, task
names) middle-truncate and auto-rotate only when needed, and label
thinning is now width-aware for both bar and line variants. Dashboard
line-chart label density is also width-aware, tuned by a
`TIME_AXIS_LABEL_SPACING_PX` constant.
- **Tests.** 46 new unit tests for the pure logic (bucket selection,
tick spacing, time-axis formatting, zoom range, truncation).

## Intentionally unchanged

- **No click/drag zoom on the dashboard or custom query charts.**
Drag-to-zoom is wired up on the task landing pages only; zooming the
dashboard and custom charts is deliberately deferred to a separate
follow-up PR. A plain click (without a drag) on a task chart is a no-op.
- **The 25 mini activity charts on the Task list (`_index`) page are
untouched.** They are hand-rolled raw-Recharts sparklines kept
deliberately lightweight and do not use these primitives.
- **Other raw-Recharts sparklines are untouched** (the usage sparkline,
errors and prompts pages).
- **No ClickHouse query semantics changed** beyond the bucket-interval
parameter (same filters, same FINAL / `_is_deleted` handling).
- **Webapp-only.** No public package (`packages/*`) changes, so there is
no changeset; the `.server-changes/` entries cover it.

---

## Testing

Added 46 unit tests covering server-side bucket selection, width-aware
tick spacing, time-axis formatting, zoom-range math, and categorical
label truncation (`pnpm --filter webapp run test`), and `pnpm run
typecheck --filter webapp` passes. Manually exercised each task landing
page (agent, standard, scheduled) plus the dashboard and custom query
charts, stepping the Date/Time filter through 5m, 1h, 24h, 7d, and 30d
to confirm dense bars on short ranges, non-overlapping labels that
reflow on resize, the synced hover line across the agent charts, the
maximize button, and drag-to-zoom updating the filter.

---

## Changelog

The activity charts on the task landing pages and the dashboard and
custom query charts now share one set of reusable primitives. X-axis
labels are width-aware so they never overlap and reflow when a panel
resizes, y-axis values are abbreviated (8K, 1.2M), and short time ranges
render dense bars instead of collapsing into a single bar. Hovering any
agent chart mirrors a vertical line on the others, every chart gains a
maximize button, and dragging across a task chart zooms the Time/Date
filter. Long categorical labels such as run IDs and task names
middle-truncate and auto-rotate only when needed.

---


https://github.com/user-attachments/assets/6be09e38-3a0e-4947-b6e3-4839daa2fbe0
## Summary

Adds Billing Limits to the webapp.

Customers can set a monthly spend cap. When usage crosses the limit,
billable environments enter a grace period. If the limit is not resolved
before grace expires, new triggers are rejected until the organization
increases or removes the limit.
<img width="2400" height="1794" alt="chat-ui-closed"
src="https://github.com/user-attachments/assets/35016a72-c6d2-4b6a-8760-b1da5b4a166c"
/>
<img width="2400" height="1794" alt="chat-ui-open"
src="https://github.com/user-attachments/assets/25b3df60-9aa2-40fd-a1ba-1447eeee4c52"
/>

## Summary

The in-dashboard agent was launched from a button pinned to the
bottom-right of every page, which floated over page controls (for
example the run inspector's action bar). It now opens from a compact
"Chat" button on the far right of the page header, and the same button
toggles to "Collapse" while the panel is open. The panel and launcher
are labelled "Chat" in the UI.

The launcher only renders on env-scoped pages where the agent is enabled
(same feature flag gating), so it stays hidden for everyone who doesn't
have it. The existing "Ask AI" support button is untouched; it stays in
place until the agent is turned on by default.

## How it works

`DashboardAgent` (env layout) shares the open/close state through a
small context, and `NavBar` renders a launcher that self-hides whenever
that context is absent. No floating overlay, and the launcher can't
appear on pages where the agent can't open.
## Summary

Several dashboard routes performed actions a restricted role should not
be able to do (cancel or replay runs, manage prompt versions, invite and
manage members, manage billing) without any permission check. This adds
role-based permission enforcement to those routes, and disables the
matching UI controls (with a tooltip) when the current role lacks
permission.

Covered actions:

- Runs: cancel and replay (single, bulk create, bulk abort)
- Prompts: create or edit override versions, and promote a version to
current
- Members: invite, resend invite, revoke invite
- Billing: change plan, billing alerts, and the customer portal

## How

Each affected route now goes through the `dashboardLoader` /
`dashboardAction` route builders with an `authorization` block declaring
the required permission (or a per-intent check where one route handles
several intents). Existing tenancy and data-scoping queries are
untouched; this only layers permission checks on top. The UI follows
disable-don't-hide: controls stay visible but disabled with a "You don't
have permission to ..." tooltip.

Two reusable pieces support this: `checkPermissions(ability, checks)`
turns a set of checks into a boolean map a loader returns to the client,
and `PermissionButton` / `PermissionLink` disable the underlying control
and show a tooltip when a permission flag is false.

## Behaviour

No change in the default configuration: permissions are permissive, so
every control stays enabled and every route behaves as before. The
checks only take effect when an RBAC plugin is installed. This also
makes role assignment on invite-accept non-fatal, so a failure there
cannot block joining an org.

Verified with `pnpm run typecheck --filter webapp`; `checkPermissions`
has unit tests.
## Summary

Typing in the search bar on the task page could clear or reset the input
mid-keystroke. This fixes the re-render race so the field stays stable
while you type.

## Root cause

Two things compounded:

- `SearchInput`'s sync effect depended on `text`, so it re-ran on every
keystroke and could overwrite the input with the URL/controlled value
while focused.
- Each task row unmounted and remounted its activity chart during the
side-panel open/close animation (25 charts at once), forcing heavy
re-renders that the search effect raced against.

## Fix

- `SearchInput` now tracks the last synced value in a ref instead of
comparing against `text`, keeping the effect off the keystroke path. It
only writes to state when the incoming URL/controlled value actually
changes, and never while the input is focused.
- Activity charts are now hidden (`hidden` attribute) instead of
unmounted during the panel animation, so the rows don't churn the tree
and the resize stays smooth.

---------

Co-authored-by: Claude Opus 4.8 (1M context) <noreply@anthropic.com>
## Summary

The Models page is now split into two tabs. **Your models** shows the
models your project has actually used in the selected time range, with
usage charts (cost over time, tokens over time, calls by model), a
per-model table of calls / cost / avg TTFC / avg tokens-per-sec, and
calls/tokens trend sparklines. **Model library** is the full catalog,
reordered from alphabetical to a relevance-based provider order
(Anthropic, OpenAI, Google, then the rest), newest models first within
each provider, with a "New" badge on models released in the last 7 days.

One time-range selector drives the whole Your models tab, so the charts,
the table, and the sparklines all share the same window. Opening a model
shows its own metrics with an independent range picker and a "View in AI
metrics" link that opens the AI metrics dashboard filtered to that
model. The active tab is kept in the URL so it survives a refresh and is
shareable.

## Prompt caching & cost accuracy

Both the Your models tab and the AI metrics dashboard now surface
prompt-cache usage: a cache-savings column plus per-model cached-tokens
and cache-hit-rate views, and a caching section on the dashboard (hit
rate, cached tokens, estimated savings, and hit rate by model).

Building this surfaced a cost bug. `input_tokens` is the total prompt
count and already includes cache-read and cache-creation tokens, but the
cost pipeline charged the full input at the input price and then added a
separate cache line, so cached tokens were billed twice (and on
Anthropic, cache reads were never discounted because their price is
keyed differently). The input price now applies only to the non-cached
remainder, with cache prices resolved across the provider-specific keys,
so LLM cost and the cache hit-rate metric are accurate. Hit rate is
computed as cached reads over total input.

## Notes

Also fixes React "invalid DOM property" console warnings from the
provider icons (the Llama and DeepSeek SVGs used raw `fill-rule` /
`clip-rule` / `clip-path` attributes), which this page surfaces by
rendering more provider icons.

## Screenshots

**Your models tab:** usage charts and a per-model table with
calls/tokens trend sparklines.

<img width="2560" height="1267" alt="1-your-models-tab"
src="https://github.com/user-attachments/assets/859bd24f-9047-4828-8bbb-83e5882846d6"
/>


**Model library:** provider-relevance ordering with a "New" badge on
models released in the last 7 days.

<img width="2560" height="1267" alt="2-model-library-tab"
src="https://github.com/user-attachments/assets/46dd54b9-80f9-4922-ade9-5935b08dfebc"
/>


**Model detail, Metrics tab:** per-model range picker and a "View in AI
metrics" link.

<img width="2560" height="1267" alt="3-model-detail-metrics"
src="https://github.com/user-attachments/assets/0f65d9d0-6142-4918-93f0-110bb277101a"
/>


**View in AI metrics:** the dashboard deep-linked and filtered to the
selected model.

<img width="2560" height="1267" alt="4-ai-metrics-filtered"
src="https://github.com/user-attachments/assets/821f256c-e305-493c-98c7-eafaf2f57f83"
/>
 Chris Arderne