deterministic-apt-layer
1534 Commits
| Author | SHA1 | Message | Date | |
|---|---|---|---|---|
 Katia Bulatova Katia Bulatova
|
fbd6df33b4 |
feat(webapp): Themes + contrast settings update (#4206)
Adds System Preferences, Dark and Light themes, gated by the `hasThemeSwitcher` feature flag (off by default — dark stays the default theme for everyone). Old theme is now "Classic"and set as default. "System preferences" theme has both Light and Dark modes and uses your laptop settings to use a correct one. It has less color accents (specifically less colored text), and they are the same for both modes, only grayscale values change between them. And Light/Dark themes can be used separately. New Contrast setting is available for System Preferences, Dark and Light themes - it changes the contrast for the whole app. All new visual Settings live in Account. |
||
|
Eric Allam
|
9d57aff542 |
fix(webapp): make the Queues hero charts environment-wide (#4486)
## Summary The four charts above the queues table aggregated over **at most the 25 queues on the current page**. They reused the loader's already-paginated queue array as a ClickHouse `queue IN (...)` filter, so paging or re-sorting changed the values, and a name search matching nothing blanked the whole chart row. The stat tiles above them were already environment-wide, so the two rows disagreed. They now read `env_metrics`, the environment-level rollup that already exists for exactly this (the built-in Queues dashboard and the health report read it). That is both correct and queue-count-independent: no `GROUP BY queue` across an entire environment, and no client-side summing. Note this is not only a paging artifact: page 1 under-reported too. On the seeded environment below, page 1 read 82% saturation against a true 87%, because the environment's running total is not the sum of one page of per-queue gauges. Three related fixes ride along. **Scheduling delay and throttling sawed to zero.** Both are event-driven, so at the 10-second bucket a short range picks, most buckets hold no samples at all and were drawn as `0ms`. Measured over a 1-hour window: **232 of 349 buckets had no scheduling-delay samples**. A bucket where nothing started is not a bucket where nothing waited, so the line was both ugly and wrong. TRQL grows a `minBucketSeconds` floor, plumbed through the metric resource route, and the hero tiles set 60s. Buckets that still have no samples render as a gap instead of a dive to zero. **The floor must not feed a width-dependent headline.** Two of the four headlines are not peaks, so widening the plotted buckets moved them: - **Throttled** is a share of buckets that saw any throttling, so a single brief throttle came to mark a whole minute instead of ten seconds: the same seeded events read 17% at 10s and 85% at 60s. - **Scheduling delay p95** is a percentile, and merging quantile states over a wider bucket yields a p95 between the sub-buckets' own. Two 240s samples among twenty in one 10-second sub-bucket give a worst-of-six p95 of 240,000ms against a merged 60-second p95 of 5,000ms — a 48x understatement of a headline whose tooltip claims it is the worst in the window. Both charts keep the floor, since a readable line was the point of it. Their headlines now come from a second query at the range's natural bucket width, via an optional `readout` on the tile, so each means what its tooltip says regardless of how the plotted buckets are sized. Saturation and backlog are genuinely width-invariant (a max of maxes is the same at any width), so they are unchanged and issue no extra query. Both caught by Devin in review; I had wrongly lumped p95 in with the peaks. **Charts reported a hydration mismatch on every render.** Recharts resolved victory-vendor's CJS entry on the server and its ESM entry in the browser. Those bundle different d3-shape builds, and the CJS one predates d3-path's digit rounding, so every server-rendered curve carried full-precision coordinates while the client rounded to 3 decimals: ``` Server: M0,3C0.9305555555555555,3,1.8611111111111112,3,... Client: M0,3C0.931,3,1.861,3,... ``` Bundling recharts for SSR makes both sides resolve the same ESM build. Verified: 45 of 45 server-rendered chart curves now match the client, and the page loads with an empty console. ## Verification An isolated stack with 40 seeded queues (20 heavily loaded, 20 idle) and 90 minutes of 10-second buckets written into `queue_metrics_raw_v1`, so the real materialized views built `queue_metrics_v1`, `env_metrics_v1` and the 5m rollup. Ground truth for the environment: 260 running against a limit of 300 (**87% saturation**), 800 queued. | | before | after | | -- | -- | -- | | Saturation, page 1 | 82% peak | **87% peak** | | Saturation, page 2 | 5% peak | **87% peak** | | Backlog / delay, page 2 | "No activity" | **800 peak / 59.5s** | | Name search matching nothing | all four charts blank | charts stay environment-wide | | Metric refetches on a page change | 4, each painting a skeleton | **0, no skeleton** | | Buckets drawn as 0ms with no samples | 232 of 349 | **0** | | Throttled readout | 17% | **17%**, unchanged by the wider buckets | | Worst-p95 readout source | plotted buckets | **natural width**, so a sub-minute spike is not averaged away | | Crosshair reach, hovering one detail-page chart | 2 of 4 others | **4 of 4** | | SSR chart curves mismatching the client | 45 | **0** | The bucket floor was measured across ranges: it widens 10s to 60s at 30m and 1h, and is correctly a no-op at 12h (300s) and 7d (3600s). One extra request per page load, for the throttled readout. The built-in Queues dashboard, which reads `env_metrics` independently, agrees at 86.7% and 260 of 300. `internal-packages/tsql` suite green (612 tests), including 5 new ones for the floor that fail without it. Webapp typecheck, oxfmt and oxlint clean. Spot-checked the Run metrics dashboard and the per-queue detail page for SSR regressions from bundling recharts: both render, console clean. The queue detail page carries the same event-driven series, so its scheduling delay, throttling and per-key mean delay take the same treatment. ## Screenshots <img width="2540" height="580" alt="after-page1-charts" src="https://github.com/user-attachments/assets/6cd23f9c-e7fd-4918-bcfa-b1d3340b16d1" /> ## Rollout Already behind the per-organization `queueMetricsUiEnabled` flag, so only gated orgs see any of it. Blast radius is chart values on one page plus the SSR bundling of recharts; rollback is a revert with no data migration. ## Stated limitations - `wait_ms_count` and the quantile state both only count `wait_ms > 0`, so "nothing started in this bucket" and "everything started instantly" are indistinguishable in storage. Both render as a gap. Distinguishing them needs a schema change, which is not in this PR. - The queue name search deliberately no longer narrows the charts. It only did so incidentally and incorrectly before (first 25 matches, and blanked on zero matches). Search-scoped charts would need the full unpaginated matching set and a server-side aggregate; worth its own ticket if we want it. - Bundling recharts for SSR grows the server bundle slightly. That is the cost of both sides resolving one d3-shape build. - The plotted delay line is a smoothed 60-second view, so a sub-minute spike above the one-minute warning threshold can fail to colour the line even though the headline reports it and colours itself. - Every chart inside one synced group shares the floor, because the hover crosshair is a reference line on a category x-axis and only draws where the hovered bucket exists in the other chart's own data. That costs the queue detail page's gauges some resolution (1 minute instead of 10 seconds) in exchange for the crosshair working across the row. Separately, while taking the screenshots I found a pre-existing rendering bug unrelated to this change: a **perfectly flat** saturation series draws no line at all (the readout still shows the right percentage), which looks like the threshold gradient's offset degenerating when the series min equals its max. It reproduces on `main`, so it is not a regression here and I have left it alone; filed as its own issue. Refs TRI-12784 |
||
|
Eric Allam
|
5f29ae49ab |
feat(webapp): default the queue metrics period to 1 hour and remember it (#4438)
## Summary

The Queues list and queue detail pages opened on a 1 day window, and
went back to it every time you navigated between queues or reloaded.
They now default to the last hour, and the period you pick is remembered
across navigations and refreshes.

## Design

The last period is stored in a `queueMetricsPeriod` cookie, written
client-side whenever a `period` lands in the URL and read by both
loaders. A cookie rather than localStorage because the queues list
renders its per-queue metrics columns server-side: with localStorage the
page would paint the 1 hour default and then re-fetch, and the picker
would flash the wrong window.

Both pages resolve the window once, in one place, and pass it down:

```ts
period: resolveQueueMetricsPeriod({
  period: value("period"),   // a usable period in the URL wins
  from: value("from"),       // an absolute range means "no period"
  to: value("to"),
  defaultPeriod,             // otherwise the remembered default from the loader
}),
```

That keeps the picker pill and every chart query on the same value, so
no call site falls back to its own default. Periods the picker could
never produce (a hand-edited `?period=garbage`, or a window past the 30
day retention) fall back to the default, and the picker renders the
resolved window rather than the raw search param so the label can't
disagree with the data. Absolute from/to ranges, including drag-to-zoom,
are not remembered, since they would pin later visits to a window that
has gone stale.

While wiring that up: the two queue-metric queries that go straight to
ClickHouse (the list table and the concurrency-keys endpoint) never
applied the org's `queryPeriodDays` limit, so a hand-typed `?period=`
read further back than the plan allows. Everything behind
`/resources/metric` is already clipped that way by `executeQuery`; both
of these now clip with the same limit, capped at the retention window,
and the plan cap is resolved once per load and handed to the page
instead of each route deriving its own copy from the client-side
subscription.

Verified on both pages: default with no cookie is 1 hr, picking 6 hrs
survives navigating away and back to a param-free URL and a hard reload,
clearing the cookie returns to 1 hr, an oversized period falls back
without being remembered, and an absolute range still renders as a
range.
|
||
|
Iss
|
8f66af6e18 |
fix(webapp): stop the sidebar feedback popover from canceling the submit (#4445)
The Help & Feedback → "Contact us" form in the sidebar intermittently failed to send. The `<Feedback>` dialog was nested inside the Help popover, so clicking **Send** closed the popover and unmounted the form mid-submit — canceling the `POST /resources/feedback` before it went out. The message was silently lost (the success toast still shows). A race, so it "worked sometimes"; the standalone "I'm stuck!" path was unaffected. **Fix:** host the Feedback dialog *outside* the popover (same pattern as `AskAIRoot`) and open it from the menu item, so closing the popover no longer tears down the form. `Feedback` gains an optional controlled `open`/`setOpen` mode; existing `button`-triggered usages are unchanged. ## Changes - `Feedback.tsx` — optional controlled `open`/`setOpen`; `button` now optional. - `HelpAndFeedbackPopover.tsx` — "Contact us…" opens a `<Feedback>` hosted outside `PopoverContent`. - `.server-changes/fix-sidebar-feedback.md` — user-facing note. ## Testing Webapp typecheck passes. Sidebar "Contact us…" now sends on every attempt (Network: `POST /resources/feedback` → `204`, never `(canceled)`); "I'm stuck!" and the `?feedbackPanel=` open path unchanged. |
||
|
James Ritchie
|
14824b0955 |
feat(webapp): fix agent overview page scroll bug + layout fixes on task and agent pages (#4454)
## Summary The task, scheduled task and agent pages now name their runs table with its own title bar, and the controls that page the table sit beside it rather than in the bar at the top of the page. The top bar keeps just the date filter. Two agent page layout bugs are fixed along the way: scrolling a wide runs table sideways dragged the charts off screen with it, and the details panel stopped short of the bottom of the window. ## Fix The charts moved because the runs table had no horizontal scroller of its own. `stickyHeader` swaps the table's `overflow-x-auto` for `overflow-visible`, so the overflow escaped up to the page scroll box, and setting only `overflow-y-auto` on that box leaves the computed `overflow-x` at `visible`, which CSS then promotes to `auto`. The chart grid is a sibling inside that box, so it scrolled too. The table now keeps its own scroller (the same rule the queues list already documents) and the page box clips x so this cannot recur. The short panel was a second `PageContainer` wrapping the agent routes. `PageContainer` is `grid-rows-[auto_1fr]`, so a lone child lands in the `auto` row and its `h-full` resolves against content height instead of the viewport. This also reverts the global tooltip `max-w-[230px]` introduced in [#4131](https://github.com/triggerdotdev/trigger.dev/pull/4131), so longer tooltips are no longer squeezed into a narrow column. ### Agent overview page showing table now scrolling <img width="3452" height="1648" alt="CleanShot 2026-08-01 at 12 04 38@2x" src="https://github.com/user-attachments/assets/ef1ac55d-8ffb-4278-983b-031ed21c1f55" /> |
||
|
James Ritchie
|
fc69101252 |
feat(webapp): AI agent logo experiments (#4399)
## Summary Adds an admin-only "AI agent" storybook page exploring an animated identity for the dashboard agent: a resting dot logo that animates while the agent is thinking, then settles once it is done. The lead experiment is a 5x5 dot matrix. Shapes are five-line string bitmaps, a bright head walks each shape's route on a fixed beat, and it only hands off between shapes on a dot the two share, so the rhythm never breaks. It comes with 26 faces, six gradient palettes, and light and dark treatments. Two earlier prototypes (a crisp logo that scatters into orbiting dots, and a dotted triangle on tilted 3D orbits) are kept in their own tabs for comparison. Everything is plain canvas code with no new dependencies. Also adds an `ask-ai` Button variant: secondary styling with a soft trigger-green border and padding tuned around the leading logo. The variant supplies the agent logo itself, so callers write `<Button variant="ask-ai/small">Ask AI</Button>`. Passing a `LeadingIcon` overrides it, which is how the thinking animation gets driven. No release note: the storybook is admin gated and the button variant is not used in product UI yet. |
||
|
James Ritchie
|
55e6225b0f |
fix(webapp): focus the search field when a filter sub-menu opens (#4443)
## Summary Opening a filter sub-menu that has its own search field left the cursor outside it, so you had to click into the field before you could type. The cursor now lands in the search field every time a sub-menu opens. `ComboBox` now focuses its input whenever the popover is open and the field is present, so the cursor lands there both when a menu opens normally and when a sub-menu mounts its field late. It is a no-op wherever focus already worked. Verified in the dashboard against the Tags menu: before, the field mounted with focus still on the popover container; after, it mounts focused and accepts typing straight away. |
||
|
claude[bot]
|
debfa2b733 | feat(webapp): impersonation consent page and a view-as-user toggle (#4421) | ||
|
Eric Allam
|
6e5f0f0fe7 |
fix(webapp,clickhouse): stop invalid customer queries alerting, and isolate Sentry scope per request (#4372)
## Summary

A query sent to the query API with a typo in it, like a column name that
does not exist, was being reported as a server error. That put customer
SQL mistakes into our error alerting, where they made up almost all of
the volume on one of our noisiest alerts, and it drowned out the
failures that are actually ours to fix. This makes the level match who
is at fault, and fixes two related problems found alongside it.

## Invalid queries are the caller's, not ours

The query API route already got this right. It checks for `QueryError`,
logs at warn, and returns a 400, with a comment saying the system
handles it gracefully and no alert is needed.

The layer underneath ignored that. `executeTSQL` logged every exception
out of its catch block at error, including the compile failures the
route was about to turn into a 400, and error-level logs are forwarded
to error reporting.

The TSQL package already draws the line we need:

```ts
export class ExposedTSQLError extends BaseTSQLError {
  /** An exception that can be exposed to the user. */
}

export class InternalTSQLError extends BaseTSQLError {
  /** An internal exception in the TSQL engine. */
}
```

`SyntaxError` and `QueryError` extend the first. So the catch block now
branches on `ExposedTSQLError` and logs those at warn, keeping error for
`InternalTSQLError` and anything unanticipated, which is a genuine
compiler bug.

## SQL the caller wrote is their mistake, not ours

The same asymmetry showed up one level down. A query that compiles fine
can still be rejected by ClickHouse at execution, and most of those
rejections mean the caller's SQL is wrong rather than that we generated
something bad.

This is where the volume actually is. Checking production, one error
group alone, a missing `GROUP BY` on the public query API
(`NOT_AN_AGGREGATE`), accounts for over a million events across hundreds
of users. It is by far the largest error group in the project, and
classifying only by resource limit would have left every one of those at
error level.

So rejections are split three ways in `ClickhouseClient`, which is the
only place holding the parsed `ClickHouseError` and its symbolic type.
By the time the error reaches `executeTSQL` it has been wrapped and the
type is gone, and the type never appears in the message text, so it
cannot be recovered by string matching.

- **Resource limits** (memory ceiling, timeout, row/byte caps) log at
warn. The query is valid, it just asked for more than it is allowed to
spend.
- **Invalid SQL** (`NOT_AN_AGGREGATE`, `UNKNOWN_IDENTIFIER`,
`SYNTAX_ERROR`, the type and parse families) logs at warn **only when
the caller wrote the SQL**.
- **Everything else** keeps alerting.

That gate matters. The client is shared, so the identical rejection on
TRQL *we* generated is our bug and has to stay at error. Callers opt in
with `userAuthoredQuery`:

| caller | who wrote the SQL | opts in |
| --- | --- | --- |
| public query API | the customer | yes |
| query editor | the customer | yes |
| agent charts | the agent's model | yes |
| built-in dashboard tiles | us, in code | no |
| queue metric cards | us, in code | no |
| health report | us, in code | no |

The agent is the one judgement call. Its TRQL is not typed by a person,
but it is also not something a code fix makes correct, so a query it
gets wrong is not worth waking anyone for. The same endpoint serves
built-in tiles whose TRQL we do write, so the opt-in lives with the
caller rather than the route.

Separately, when one of these queries did fail, the log recorded the
generated ClickHouse SQL but not the query the caller actually wrote,
which made the reports hard to act on. `queryWithStats` takes an
optional `logFields` that `executeTSQL` uses to attach the original
TSQL.

## Events were attributed to the wrong request

Chasing the above turned up something broader: only a tenth of the
events on that alert pointed at the query API. The rest were pinned to
unrelated requests that happened to be in flight at the same time, so
the alert looked like the trigger endpoint was failing.

`Sentry.init` runs with `skipOpenTelemetrySetup: true`, because we
register our own OTel pipeline. That skips `initOpenTelemetry`, and one
of the things it does is:

```js
api.context.setGlobalContextManager(new SentryContextManager());
```

The async-context strategy is still installed, but `withIsolationScope`
only marks the OTel context and delegates the actual fork to that
context manager:

```js
// "We depend on the otelContextManager to handle the context/hub"
return api.context.with(ctx.setValue(SENTRY_FORK_ISOLATION_SCOPE_CONTEXT_KEY, true), ...)
```

`provider.register()` installed a plain
`AsyncLocalStorageContextManager`, which does not know that key. The
lookup found no scopes on the context and fell back to the
process-global default isolation scope, so every request wrote its
request data into the same object and the last writer won.

The tracer now registers `SentryContextManager`, which subclasses
`AsyncLocalStorageContextManager`, so OTel behaviour is unchanged. It is
also registered on the path where tracing is disabled, which previously
never called `register()` at all and so had no context manager of its
own.

Tenant tags were always correct, because those come from our own async
local storage rather than the isolation scope. That is why the
attribution being wrong was not obvious.

This affects every error report the webapp sends, not just the query
API.

## Verification

`internal-packages/clickhouse`: 76 tests pass, including eight covering
each level decision against a real ClickHouse container. Three pairs pin
the gate open and shut at both layers: an invalid query, a compile
failure, and a real limit breach driven with `max_rows_to_read` each log
at warn with `userAuthoredQuery` and at error without it.

The isolation fix has a test that reproduces the leak before asserting
the fix. Two overlapping requests each tag their own isolation scope;
with the plain context manager the slower one reads back the other's
tag, and with `SentryContextManager` each reads back its own.

Measured separately against a faithful reproduction of the server's
wiring (own OTel pipeline, CommonJS entry) at 200 concurrent requests:
per-request attribution goes from 0.5% to 100%, while span nesting,
context propagation across awaits, and distinct trace IDs are identical
before and after.
|
||
|
Eric Allam
|
4eb9292cbe |
feat(webapp,run-engine): queue metrics and health dashboard (#4131)
## Summary

Three related changes, each independently gated:

**Queue metrics and health.** Per-queue depth, throughput (enqueued,
started, completed), concurrency, whether a queue is throttled, and
scheduling delay (how long a run waits between becoming eligible and
actually starting), plus a per concurrency-key breakdown for keyed
queues. Collected from inside the run queue itself, stored in
ClickHouse, and surfaced on the Queues list, a new per-queue detail
page, the task pages, and the run inspector. The question it answers is
"does this queue have enough concurrency to keep up, and if not, which
key or which limit is the constraint".

**Percent-based queue concurrency limits.** A queue's concurrency
override can now be expressed as a percentage of the environment limit,
stored as the source of truth and re-materialized whenever the
environment limit changes. Absolute overrides above the environment
limit are now **rejected with a 400** instead of being silently capped,
which is a behavior change on `POST
/api/v1/queues/:queue/concurrency/override`.

**The `health` report.** A server-computed verdict on whether work is
flowing, whether the runs that do start are healthy, and whether
telemetry is fresh, rendered as text with sparklines. Available as `GET
/api/v1/reports/:key`, `trigger report`, and the `get_report` MCP tool
(plus a `report` MCP prompt, which shows up as a slash command in hosts
that support prompts).

With the flags off, the Queues page renders the pre-metrics component
verbatim, nothing is emitted, and nothing is written to ClickHouse.

## Configuration

Two independent gates, on purpose. Emission is global so data accrues
for everyone before anyone can look at it; the view is per organization
so it can be turned on for one org at a time without a deploy.

**Runtime flags (no restart)**

| Flag | Store | Gates |
| --- | --- | --- |
| `queue_metrics:enabled` | run-queue Redis key (`"1"`/`"0"`, off by
default) | All emission, gauges and counters. Cached in-process for 10s
with stale-while-revalidate, warmed eagerly at boot so the first op
after a deploy is not dropped. |
| `queue_metrics:gauge_sample_rate` | run-queue Redis key, `0..1` |
Fraction of queue ops that emit a gauge. Counters are never sampled, so
throughput stays exact at any rate. |
| `queueMetricsUiEnabled` | feature-flag catalog: global `FeatureFlag`
row, per-org `Organization.featureFlags` override wins | Whether an org
sees the metrics view at all: the Queues list variant, the queue detail
route, the built-in Queues dashboard, the concurrency-keys endpoint, and
the metrics blocks on task pages and the run inspector. Off by default;
a gated org gets a 404 on the detail route rather than an empty page. |

Both Redis keys are readable and writable from `/admin/queue-metrics`
(super-admin UI, with a live per-shard stream-health table) and
`GET`/`POST /admin/api/v1/queue-metrics` (admin PAT). The admin surface
uses its own Redis client, so it works on any instance regardless of
whether that instance runs the emitter or the consumer.

**Environment variables (boot time)**

| Variable | Default | Notes |
| --- | --- | --- |
| `QUEUE_METRICS_EMIT_ENABLED` | `0` | Constructs the emitter and
injects it into the run engine. Without it the run queue has no emitter
at all. |
| `QUEUE_METRICS_CONSUMER_ENABLED` | `0` | Boots the stream consumer on
this instance. Independent of emission, so consumers can be sized
separately from the API. |
| `QUEUE_METRICS_STREAM_SHARD_COUNT` | `4` | Stream shards, hashed per
queue. |
| `QUEUE_METRICS_CONSUMER_BATCH_SIZE` | `1000` | Poll batch equals
insert batch, so an ack can never outrun a write. |
| `QUEUE_METRICS_REDIS_{HOST,PORT,USERNAME,PASSWORD,TLS_DISABLED}` |
falls back to the run-queue Redis | Set `HOST` to move the metrics
stream onto a dedicated instance so a metrics backlog cannot compete
with the run queue for memory. Self-hosters can leave it unset and get a
single-Redis deployment. |
| `QUEUE_METRICS_COUNTER_STREAM_MAXLEN` | `2000000` shared, `8000000`
dedicated | Bound on how much a stalled consumer can hold. The default
is deliberately lower when the stream shares the queue-critical Redis. |
| `QUEUE_METRICS_COUNTER_ODOMETER_TTL_SECONDS` | `604800` | TTL on the
per-queue cumulative counter key, refreshed on every write, so only
queues idle for the whole window are purged. |
| `QUEUE_METRICS_MAX_QUEUE_NAMES_PER_ENV` | `1000` | Distinct queue
names tracked per environment; overflow collapses into `__overflow__`. |
| `QUEUE_METRICS_MAX_CONCURRENCY_KEYS_PER_QUEUE` | `10000` | Same idea
one level down, per queue. |
| `QUEUE_METRICS_GAUGE_SAMPLE_RATE` | `1` | Default for the live
sample-rate key above. |
| `QUEUE_METRICS_QUERY_TABLES_VISIBLE` | `0` | Lists the queue-metrics
tables in the Query page, its schema docs, the schema API and the AI
query context. Off keeps them unlisted while the feature is dark; a
query naming them still runs either way. |
| `QUEUE_METRICS_CLICKHOUSE_URL` | falls back to the shared wiring |
Runs queue metrics on their own ClickHouse service: the consumer's
inserts and every queue-metrics read go through it, so a metrics-heavy
chart refresh never competes with runs-list or trace reads. Unset
reproduces the previous split exactly (inserts on `CLICKHOUSE_URL`,
reads on the query pool). |
| `QUEUE_METRICS_CLICKHOUSE_READER_URL` | the write URL | Reader split,
so the consumer's inserts can never land on a read endpoint. |
|
`QUEUE_METRICS_CLICKHOUSE_{KEEP_ALIVE_ENABLED,KEEP_ALIVE_IDLE_SOCKET_TTL_MS,MAX_OPEN_CONNECTIONS,LOG_LEVEL,COMPRESSION_REQUEST}`
| `1`, unset, `10`, `info`, `1` | Pool tuning, matching the other
per-workload ClickHouse clients. |

Migrations to apply: ClickHouse `036_create_queue_metrics_v1.sql`, and a
Postgres migration adding the nullable
`TaskQueue.concurrencyLimitOverridePercent`. Both are additive.

## How collection works

Queue operations produce two kinds of signal, and they have opposite
failure modes, so they are handled differently.

**Gauges** (queued, running, queue limit, env queued, env running, env
limit, throttled, plus keys-with-backlog and worst-key wait on keyed
queues) are read *inside* the same Redis script that performs the
enqueue or dequeue, so the reading is atomic with the operation it
describes rather than a racy follow-up read. The script returns them on
its reply and the app forwards them to the stream. Gauges are sampled
and drop-tolerant: they are aggregated with `max`, so a lost reading
costs resolution, never correctness.

**Counters** (enqueued, started, completed, plus nack and dead-lettered)
are cumulative odometers. Each event increments a per-queue key on the
metrics Redis and emits the absolute total, and ClickHouse takes the
difference across buckets at read time. This is the important property
of the design: a summed-delta counter undercounts permanently on any
lost event, while a cumulative one self-heals, because the next
surviving reading restates the whole total. Only bucket granularity can
be lost, never the total. A queue returning after its odometer TTL
expired restarts at 1 and reset detection handles it, which is safe
precisely because expiry only spans a window with no activity.

Both land on one sharded Redis stream. A consumer reads it with a
consumer group, reclaims stale pending entries on a 15s interval rather
than on every poll, maps one entry to one or two ClickHouse rows
(whole-queue and, for keyed queues, per-key), and acks only after the
insert lands. Each batch carries a dedup token derived from its
stream-entry ids, and the target tables set
`non_replicated_deduplication_window`, so a retried batch cannot
double-count either the raw rows or the aggregates that hang off them.
Consumer and emitter both emit OTel metrics
(`queue_metrics.emitter.emitted`,
`queue_metrics.consumer.{entries,rows_inserted,insert_errors,insert_duration,stream_depth,group_lag,pending,lag_unknown}`);
stream depth and group lag are the two worth alerting on, and
`lag_unknown` exists because Redis can report a null lag after a trim,
which must not be read as zero.

## Storage and read path

`queue_metrics_raw_v1` is a short landing table with a 6 hour TTL. Four
aggregate tiers are materialized straight from raw, never cascaded off
each other, each with a 30 day TTL:

- `queue_metrics_v1`, 10 second buckets per queue, the default read path
- `queue_metrics_5m_v1`, 5 minute buckets per queue, for wide ranges and
cross-queue ranking
- `env_metrics_v1`, 10 second buckets per environment, queue-independent
so it stays cheap at any range
- `queue_metrics_ck_v1`, 10 second buckets per concurrency key

Every tier is an MV from raw because the counter states do not survive a
cascade: their merge is order sensitive, so a `-MergeState` chain off
the 10s table inflates the result, and the same property means an
aggregate state may only be merged inside one queue. That constraint is
now enforced by the query engine rather than by reviewer discipline: a
column can declare a `mergeGroupKey`, and any query that references it
without grouping by, or pinning to a single value of, every named key
fails to compile with an actionable message.

On the read side, TRQL gains three tables (`queue_metrics`,
`env_metrics`, and a `queue_metrics_by_key` that is hidden from the
editor, schema docs and schema API but still queryable, so per-key rows
can never silently merge into a plain per-queue query), plus
`deltaSumTimestampMerge` and `quantilesTDigestMerge`. Two schema-level
optimizations ride along: a table can declare coarser rollups, so a
query whose bucket interval is 5 minutes or wider is routed to the 5m
table with no change to the query itself, and it can opt into the
ClickHouse query cache with time bounds floored to a fixed grid, so the
auto-refreshing dashboards actually share cache entries instead of
missing on every tick. Both are caller-side substitutions, so the
printer stays unaware of physical layout.

All of this can also live on its own ClickHouse service. A table
declares the pool its reads run on, the three queue-metrics tables name
the dedicated one, and the ingestion consumer writes through the same
client, so both directions move together with one env var and nothing
else routes differently.

The other engine change is opt-in gap filling: charts can request rows
for empty buckets, where counters zero-fill and gauges carry forward.
Grouped gauge series are densified per group and carried inside a
partition, so a quiet queue's line holds its last value without bleeding
another queue's value into it.

## Queue concurrency limits

`concurrencyLimitOverridePercent` on `TaskQueue` is the source of truth
when an override is set as a percentage; the absolute `concurrencyLimit`
is materialized from it (floored, clamped to at least 1 so a percentage
can never act as a pause, and never above the environment limit). Every
path that changes an environment limit now recalculates the
environment's percent-based overrides afterwards, outside the
transaction, and pushes changed limits to the engine. The push is
attempted even when the stored value did not change, so a previously
failed sync self-heals rather than leaving the database and the engine
diverged; paused queues are skipped so a recalculation cannot
effectively unpause one.

The API accepts exactly one of `concurrencyLimit` or `percent`, and the
reject-instead-of-clamp change above means a request asking for more
than the environment allows now fails loudly. The percent bound (greater
than 0, at most 100) is defined once and shared by the zod schema, the
dashboard mutation handler and the service, so the three cannot drift.

The concurrency-keys table on a queue is now paginated against the
ClickHouse per-key tier, ranked by peak backlog with the total on every
row from a single scan, and only the keys on the current page are
enriched with live counts from Redis. That replaces a hard top-50 cap
with something whose cost is a function of page size rather than key
cardinality.

## The health report

`GET /api/v1/reports/:key?period=&format=markdown|ansi|json`. The
verdict is computed on the server and is deterministic, not
model-generated. Three independent analyzers run over one input
snapshot: flow (is work moving, and if not, is the cause a limit,
throttling, one bad queue, or dead-lettering), execution (are the runs
that start succeeding, and at what latency), and liveness (how fresh is
the telemetry). When telemetry is genuinely stale, the first two are
forced to unknown and every actionable field is stripped, so no surface
ever advises action off stale data.

Authorization is per query table rather than a blanket query grant: a
JWT must be scoped to every table the report reads (`runs`,
`env_metrics`, `queue_metrics`), so a narrowly scoped token cannot pull
a report that reads more than it was granted. `period` is validated as a
shorthand with a 90 day ceiling at the edge. The report catalog is a
registry of `{ load, interpret }` entries, so the next report is a new
entry and no change to the route, the view model, the renderers, the CLI
or the MCP tool.

`trigger mcp` no longer launches the install wizard when stdout is a
TTY, which fixed a real failure: hosts spawn the server over a PTY, so
the wizard would open and the client would time out waiting for a server
that never started. The wizard now needs `trigger mcp --install`.

## The part that is live regardless of every flag

The enqueue and dequeue scripts now return a 2-tuple so a gauge reading
can ride back on the reply. Every return site in the eight affected
scripts is wrapped, and a `nil` original is converted to `false` on the
way out, because a raw `nil` in the first slot would make Lua truncate
the multi-bulk reply and silently drop the gauge on the throttled and
empty-queue paths. The reply shape and the destructuring on the app side
are exercised on every queue operation whether or not metrics are
enabled, so that is the part of `run-engine` worth the closest review.

One behavior fix in the same area: the scheduling-delay anchor is set
only on a run's first entry into the queue. Anchoring it to trigger time
on re-enqueues made waitpoint and checkpoint resumes report the entire
wait as scheduling delay. Queue ordering is untouched, so a re-enqueued
run keeps its position, and nacks deliberately keep the original anchor
because a rolled-back dequeue is the same continuous wait.

A pending-version promotion still anchors to trigger time, on purpose:
that promotion is the run's first real entry into the queue, since the
trigger deliberately held it back waiting for a worker version, and the
TTL is armed at the same point for the same reason. The consequence is
worth naming, because it is a judgement call: a run that waits on a
deployment reports that wait as scheduling delay on its queue, which is
time unrelated to queue capacity.

## Verification

Unit and integration suites across the new package, the run queue, the
mapping layer, the query engine and ClickHouse (including a test that
applies migration 036 through the same splitter CI uses, and a
regression test that inserts the same batch three times to prove the
aggregates do not inflate). Beyond that, the whole path was driven end
to end against a live stack with real runs: emitter to Redis stream to
consumer to ClickHouse to the dashboards, for both the local dev path
and the deployed path where a supervisor drives the dequeue, with
assertions on exact counter reconstruction per queue and per concurrency
key, throttling, environment saturation, scheduling delay, and a
deliberate mid-stream reading drop to confirm the cumulative counters
still reconstruct the correct total. The gated-off state was checked on
every touched surface.

The dedicated ClickHouse service was verified against a second,
separately-schema'd instance: with it configured, the driven counters
reconstruct exactly on the dedicated instance, the shared instance gains
no rows for that window, a read through the query API returns the value
that exists only on the dedicated instance, and a `runs` query still
succeeds (it would fail outright if it were mis-routed to a service
without that table). With the variable unset, the full suite passes
unchanged.

---------

Co-authored-by: Katia Bulatova <katia@trigger.dev>
Co-authored-by: Katia Bulatova <katherine.bulatova@gmail.com>
Co-authored-by: James Ritchie <james@trigger.dev>
|
||
|
James Ritchie
|
a11e5ffbc6 |
fix(webapp): fade overflowing side menu selector labels (#4412)
Long organization, project, and environment names in the side menu were cut off mid-character. They now fade out at the right edge like the rest of the side menu items already did. ### Example of faded long names: <img width="246" height="200" alt="CleanShot 2026-07-28 at 22 59 24" src="https://github.com/user-attachments/assets/efa60b87-286f-4ab0-9d4e-490ef2de53e5" /> |
||
|
James Ritchie
|
73eb4c5c16 |
feat(webapp): Improve the Integrations page layout (#4379)
## Summary The project Integrations page now uses the same settings layout as the org SSO page: a centered column of titled rows with dividers, instead of headings over bordered boxes. GitHub, Vercel and build settings read as one consistent list, and the page titles itself "Integrations". Confirmations persist rather than vanishing once you move past them (`GitHub app: Installed`, `Vercel project: Connected`), plan-gated rows offer an Upgrade button instead of a dead toggle, a disabled toggle explains why in place and highlights the control that unlocks it, and warnings are rows with a hazard icon and their recovery action on the right. Copy throughout leads with the outcome instead of restating the field label. Two fixes along the way: a nested `<form>` in the Vercel panel that failed hydration and silently truncated the page, and every settings row carrying a few pixels more space above its title than below its description. ### Before <img width="1160" height="1972" alt="CleanShot 2026-07-26 at 21 56 42@2x" src="https://github.com/user-attachments/assets/ed0fd676-36d8-4eb7-a16e-827a24f007d9" /> ### After <img width="1358" height="4455" alt="CleanShot 2026-07-26 at 19 14 28@2x" src="https://github.com/user-attachments/assets/6a635e6a-c0eb-4a4c-a68f-fcde4d25e8a6" /> |
||
|
James Ritchie
|
d30ee6e570 |
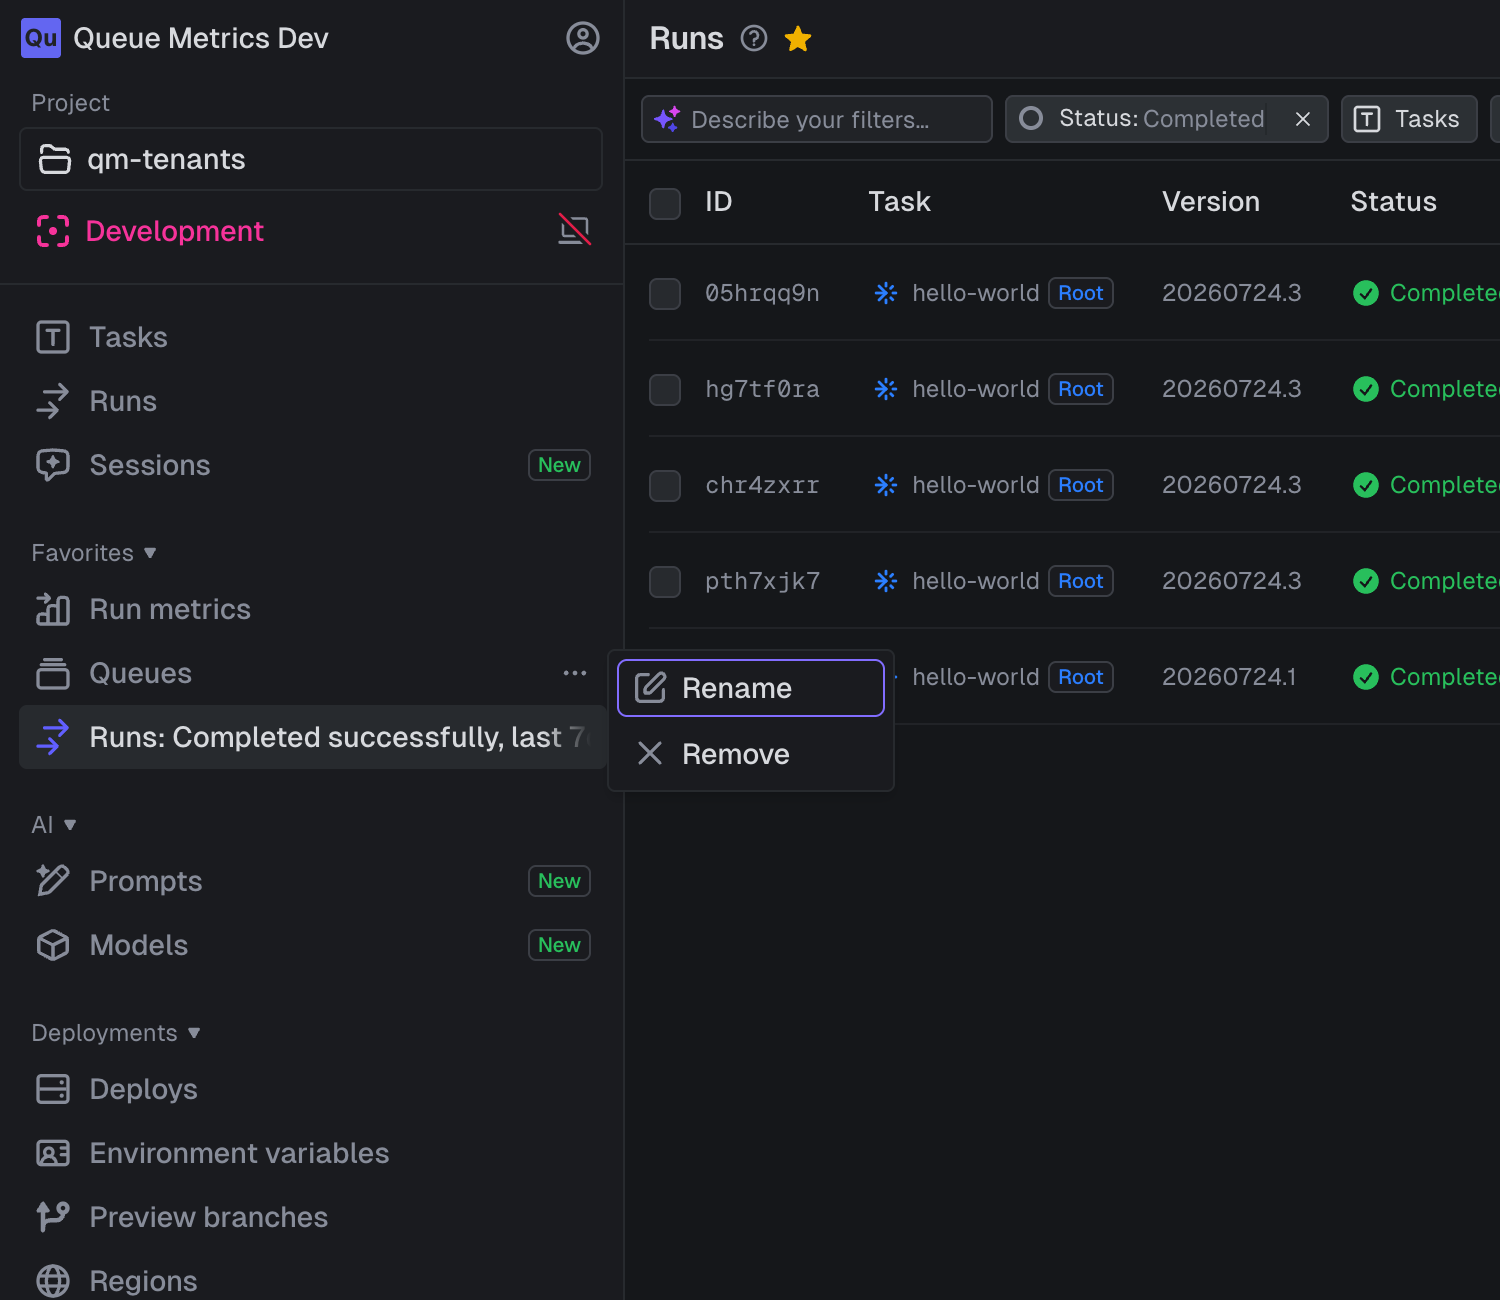
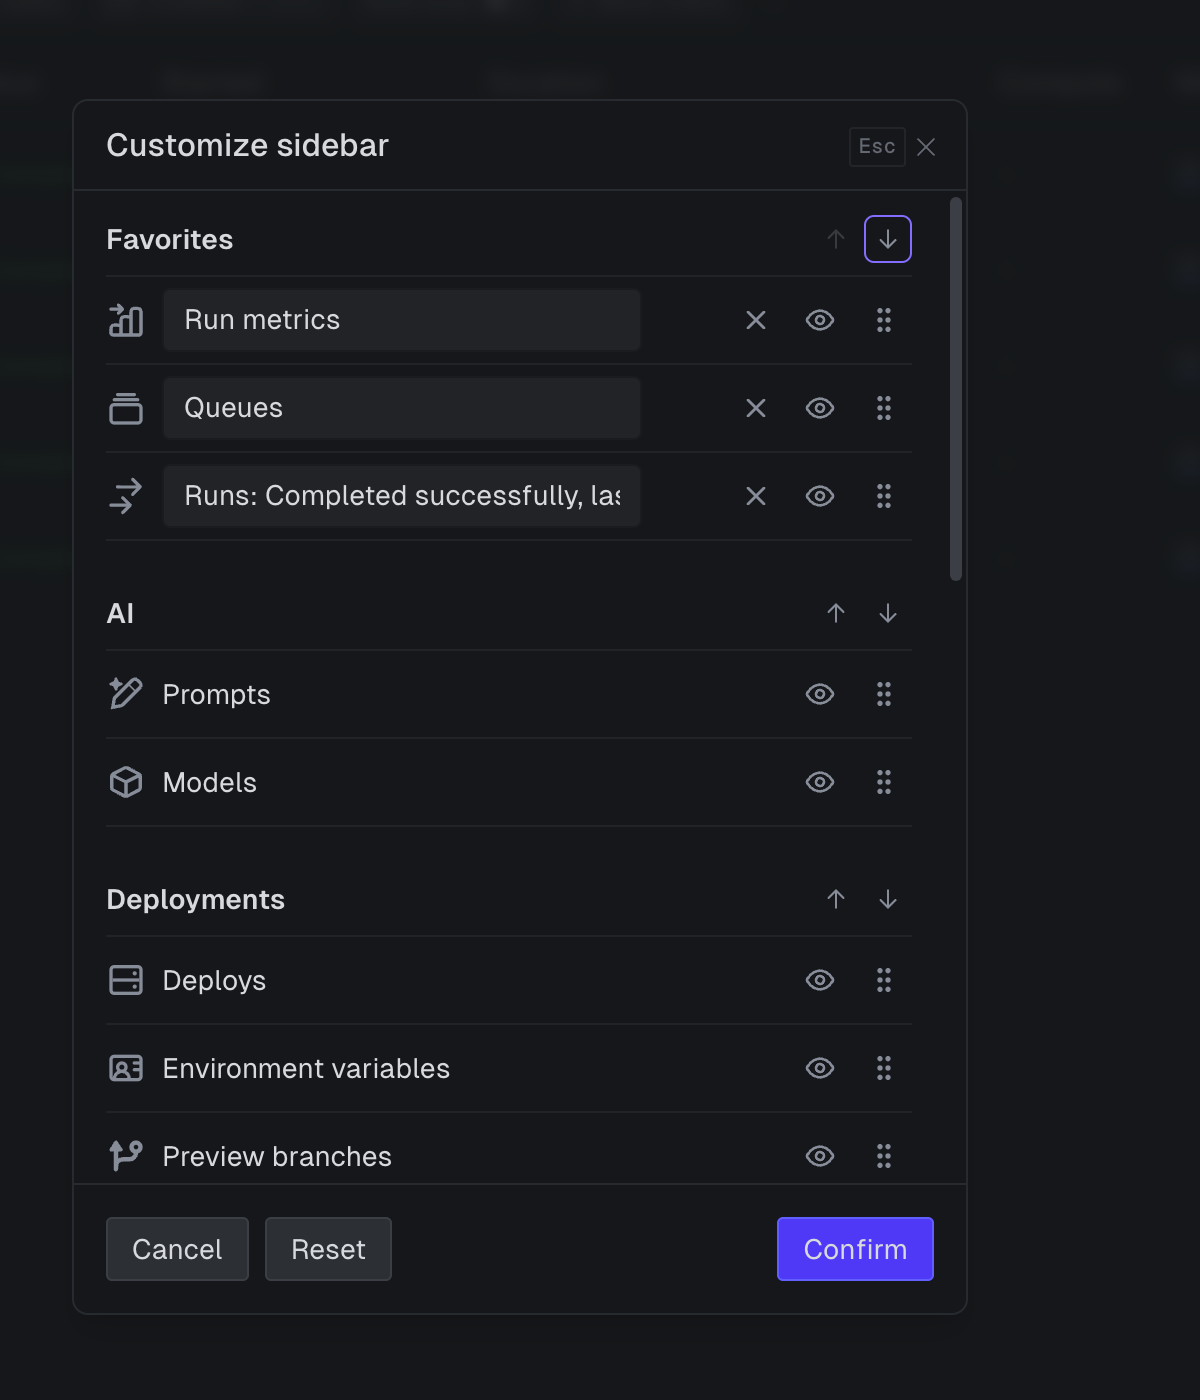
feat(webapp): favorite pages and sidebar customization (#4375)
## Summary
Favorite any dashboard page and it appears in a new "Favorites" section
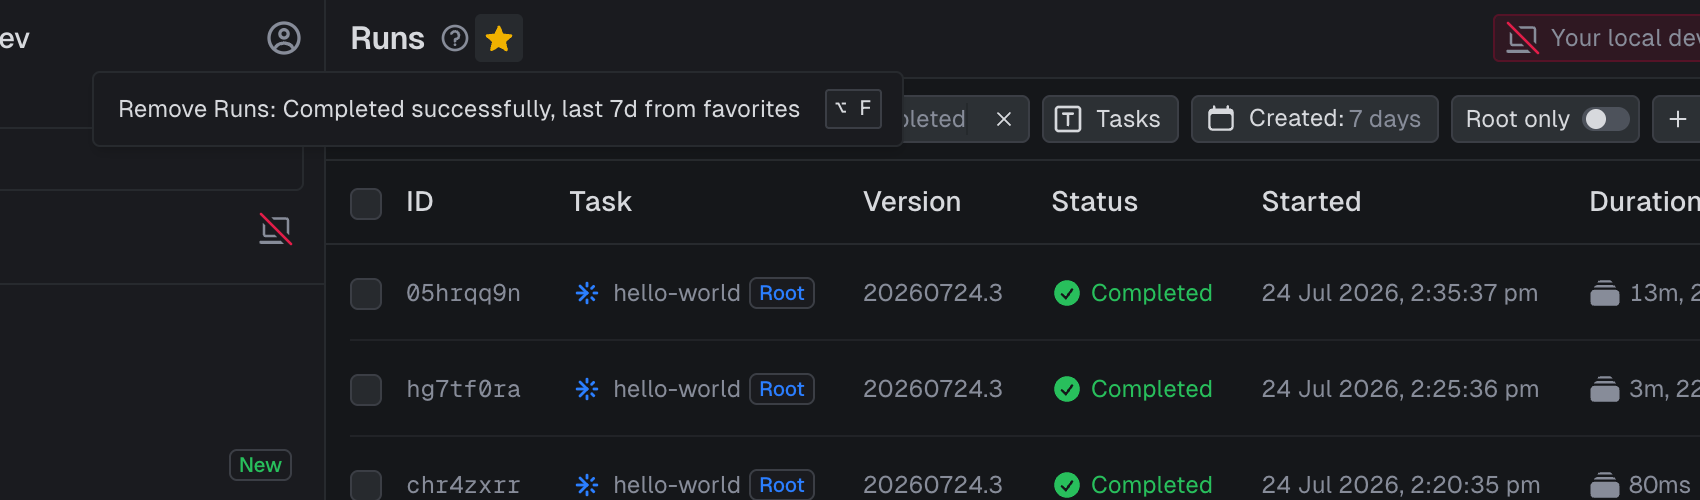
at the top of the side menu. The star next to the page title (or
Option+F) saves the exact view, filters and tabs included, with a name
derived from the URL ("Runs: Completed successfully, last 7d", "Run:
05hrqq9n") that you can rename inline from each item's hover menu.
The sidebar is customizable too: "Customize sidebar" (on section header
menus and in each "More" menu) opens a modal where you can reorder
sections, drag items into a new order, hide items behind a per-section
"More" popover, and rename or remove favorites. Changes apply on
Confirm, Reset restores the default layout without touching favorites,
and everything is stored per user in dashboard preferences.
## Screenshots
| Favorites in the side menu | Customize sidebar modal |
| --- | --- |
| 
| 
|
## Design notes
- Favorite links carry a small marker search param so the favorite, not
its identical main menu item, highlights as active. Markers from shared
or stale links are cleaned on load, and changing any filter hands the
highlight back to the regular menu item.
- Preference writes are serialized with a row lock: several writers
(debounced collapse and width saves, favorite toggles, the customize
modal) can land concurrently and would otherwise clobber each other's
read-modify-write of the JSON column.
- Option+F is matched on `event.code` with a raw listener because macOS
reports Option-modified letters as symbols, which the `event.key` based
shortcut hook can't capture.
Verified end-to-end in the browser: star toggle and shortcut, instant
section appearance, inline rename and staged modal removal, filter-aware
labels and unique active states, shared-link normalization, drag
reordering, and persistence across reloads.
|
||
|
James Ritchie
|
3e53404f40 |
feat(webapp): live-update the runs list on task pages (#4377)
## Summary The runs list on a task's page now updates live, matching the main Runs page. Run rows update their status, duration, and cost in place as runs progress, and a "N new runs" button appears in the header when newer runs come in so you can pull them into the list without a manual refresh. This applies to both standard and scheduled task pages. ## Design It reuses the Runs page's polling hook. A task page scopes its runs by the task in the URL path rather than a `tasks` query filter, so the hook now takes an optional task slug and scopes new-run detection to it. The "new runs" button sits in the header, outside the deferred runs table, so the count is lifted to the page and the click action is passed through a ref. That keeps the table streaming on first load instead of blocking the header on the runs query. When newer runs come in, a `1 new run` button appears in the task page header, to the left of the time filter. Clicking it pulls the new runs into the list. |
||
|
claude[bot]
|
109e245d56 | feat(webapp): show the first and last characters of a new PAT (#4363) | ||
|
Katia Bulatova
|
23d5771d56 |
feat(webapp): unconfigured billing limit UX and default billing alerts (#4328)
## Default billing alerts + billing limit page UX - New orgs get default billing alerts: $5, $100, $500, $1000, $2500. Existing orgs are backfilled by a billing-side data migration (companion [PR](https://github.com/triggerdotdev/cloud/pull/1657)). - The billing limit form starts with nothing selected for orgs that never set a limit — the save button appears once an option is picked. - The yellow banner now also shows on the billing limits page itself, asking to configure a limit. Hidden everywhere for members who can't manage billing. - Also fixes billing limit alert preview. Tests - `apps/webapp/test/billingLimitsRoute.test.ts` — dirty logic for empty/selected mode - `apps/webapp/test/billingAlertsDefaults.test.ts` — default values - `apps/webapp/test/billingAlertsFormat.test.ts` — preview after a limit change |
||
|
James Ritchie
|
11d8a05fa6 |
fix(webapp): restore admin debug tooltip on Tasks and Runs, make its IDs copyable (#4332)
Restores the debug panel on the **Tasks** and **Runs** pages, and makes the data it shows copyable. Admin/impersonation only — no change for regular users, so there's no `.server-changes` <img width="909" height="1420" alt="CleanShot 2026-07-22 at 12 05 27@2x" src="https://github.com/user-attachments/assets/ce2da167-dc23-422f-83f3-4f4aee9ed32c" /> |
||
|
Matt Aitken
|
81eac67069 |
fix(webapp): correct docs link on the blank prompts page (#4247)
## Summary The empty-state panel on the Prompts page linked to a docs path that no longer exists, so the "Prompts docs" button returned a 404. It now points to the current prompts documentation at /docs/ai/prompts, matching the link already used in the page header. |
||
|
James Ritchie
|
e7de120661 |
fix(webapp): remove Enterprise badge from SSO & Directory Sync menu item (#4333)
## What The organization side menu previously showed an "Enterprise" badge next to the SSO & Directory Sync item for any org not on the enterprise plan. That badge is now removed so the item renders without it. ## Screenshot (before) <img width="1428" height="649" alt="CleanShot 2026-07-10 at 08 24 41" src="https://github.com/user-attachments/assets/b9787363-972f-4dd5-bf61-486680f49f4c" /> |
||
|
James Ritchie
|
0b2919465c |
feat(webapp): redesign the side menu project and organization menus (#4066)
Redesign of the main side menu: separates Projects and Accounts from the Organization menu and makes the menu resizable. **Main changes** - **Organization & Account menus**: the top-left is now a dedicated organization menu (Settings, Usage, Billing, Team, SSO, integrations), with a separate account menu beside it (Profile, PATs, Security, Logout). - **Project switcher**: a new Project section above the Environment selector. - **Resizable side menu**: drag the right edge to set a custom width (saved per user), or click the edge to collapse/expand. - **Environment selector**: reworked to match the Project menu, including dev-branch handling. - **Account Profile page**: redesigned into the Security page's row-and-divider layout. Preview URL: https://samejr-org-menu-update.triggerlabs.dev/ https://github.com/user-attachments/assets/9b199576-6037-4ea6-9bdb-3ee15265b8c2 |
||
|
Katia Bulatova
|
d05f1a7398 |
chore(webapp): migrate from Remix compiler to Vite (#4188)
Replaces Remix compiler with the Vite plugin. The Express server (cluster, socket.io, ws) and the Docker image contract are unchanged. |
||
|
nicktrn
|
0ff0abd776 |
fix(webapp): recover from stale /build assets via a bounded reload (#4282)
## Problem The webapp's HTML references content-hashed `/build` assets, and each running instance contains exactly one build and returns 404 for asset hashes it doesn't have. During a rolling deploy a client can hold HTML from one build while a request for one of its assets is served by an instance on a different build → missing styles or a failed chunk load. ## What this does On a `/build` stylesheet/script/chunk load failure, the client does a **bounded full-document reload** (at most 2 per 5 minutes, tracked in `sessionStorage`) so the page reloads onto a single consistent build. That's the whole mechanism — no polling, no `fetch` interception, no blocking overlay, no form snapshotting. - `apps/webapp/app/components/StaleAssetRecovery.tsx` — authored as a typed, lint-checked function and serialized to an inline script via `.toString()` (so the logic is real, reviewable code, not an opaque string), injected before `<Links />`, production only. - Detection: capture-phase `error` listener for `<link>`/`<script>`/modulepreload failures under `/build/`, plus an `unhandledrejection` guard for dynamic-import failures. - Guards: once-per-page re-entrancy guard, the bounded reload budget, and a `navigator.onLine` check so it never reloads into an offline error page. - Unit tests in `StaleAssetRecovery.test.ts`. ## Relationship to #4260 Replaces the recovery introduced in #4260 (reverted in #4280) with a much smaller, reload-only approach — the previous version intercepted `fetch` and could turn a data request into a navigation, and showed a full-screen overlay on any asset error; this drops both. ## `/build-version` compatibility shim `apps/webapp/server.ts` adds a tiny `GET /build-version` endpoint (build id only, `no-store`). A previously-deployed client build polls it after an asset failure and reloads once it sees a newer build, so those older tabs recover in one reload instead of getting stuck. Temporary — safe to remove once older clients have cycled out. It deliberately does **not** re-add an `X-Build-Id` response header. ## Also Restores the `.server-changes` writing guidance in `.claude/rules/server-apps.md` (reverted alongside #4260). ## Self-hosting note Recovery is most reliable when your load balancer keeps a client on one instance for the duration of a deploy (short session stickiness) — the reload then lands on a consistent build in one hop. |
||
|
nicktrn
|
051d7080d6 |
Revert "fix(webapp): survive asset hash rotation across rolling deploys (#4260)" (#4280)
Standard `git revert` of #4260. Its client-side stale-asset recovery is net-negative during normal deploys: - The `fetch` interception treats any `?_data=` request (Remix loader **and** action traffic) as a navigation and, on a build-id mismatch, `location.assign`es the tab to the fetched URL — an open dashboard tab can be hard-navigated to a raw data URL during a rolling deploy, losing unsaved input. - Any transient `/build` asset error (a network blip, an extension, an unrelated failed dynamic import) blanks the page behind a full-screen overlay for ~60s before offering a manual reload. - It serialized form field values to `sessionStorage` to restore them across the reload. This returns the webapp to the pre-#4260 baseline as a fast, low-risk step. Follow-ups (separate PRs): - a minimal reload-only recovery to replace this, - restore the unrelated `.claude/rules/server-apps.md` docs tidy-up from #4260 (via cherry-pick), - a load-balancer stickiness change addressing the root cause. |
||
|
Katia Bulatova
|
2aa64200f8 |
fix(webapp): survive asset hash rotation across rolling deploys (#4260)
### Problem Webapp HTML references content-hashed /build assets, and each Docker image contains exactly one build with a hard 404 for unknown hashes. During a rolling deploy, a client holding HTML from the old build may request old asset hashes from a replica running the new image, causing missing styles or failed chunk loads. The page should recover automatically once a compatible build becomes available, without reload loops or unnecessary interruptions during normal deployments. ### What changed - Build changes alone do nothing — no polling, no automatic reloads. - If a CSS or JavaScript asset fails to load, a recovery overlay is shown immediately. - While the server still reports the same build, the client polls for a newer build using exponential backoff (up to ~60s). As soon as a newer build is detected, the page reloads automatically. - If no newer build appears within the timeout, recovery falls back to a manual Reload action. - If recovery still fails after the automatic reload, the client stops retrying and displays a final recovery screen instead of entering a reload loop. - Recovery preserves form values and scroll position across the automatic reload. |
||
|
Eric Allam
|
5ba8557a51 |
chore(webapp,core): remove the end-of-life v3 (engine V1) execution stack (#4236)
## Summary v3 (the engine that ran the SDK v3 era, internally `RunEngineVersion.V1`) is end-of-life. Following the removal of the v3 execution apps ([#4194](https://github.com/triggerdotdev/trigger.dev/pull/4194)) and the legacy dev websocket ([#4198](https://github.com/triggerdotdev/trigger.dev/pull/4198)), this removes the remaining v3 execution stack from the server. Clients still on v3 (an old SDK or CLI that has not upgraded) keep getting a clear "upgrade to v4" response. Triggers, batch triggers, reschedules, and deploys that resolve to v3 are rejected with a graceful 4xx pointing at the migration guide, never a 5xx, so a stale client cannot affect server health. Self-hosted instances still running v3 should stay on the 4.5.x release line until they migrate. ## What is removed - The MarQS queue and its shared/dev queue consumers. - The v3 socket.io namespaces (coordinator, provider, shared-queue) and the v3 run lifecycle services (attempt, checkpoint, and batch-resume). - The graphile-worker background job system; all live jobs already run on `@trigger.dev/redis-worker`. - The `DEPRECATE_V3_ENABLED` flag: v3 is now rejected unconditionally, so the flag is gone. - Unused v3 exports from `@trigger.dev/core` (the `v3/zodNamespace` subpath and the legacy socket message catalogs) and the now-dead MarQS environment variables. ## What stays The v4 engine is untouched. The graceful v3 rejection boundary stays, `determineEngineVersion` still detects a v3 project so it can reject it, and the batch service plus batch-completion worker stay for current clients. Live queue concurrency limits and metrics now read from the v4 run engine instead of MarQS, and a brand-new dev environment now defaults to v4. ## Dependency cleanup Removes webapp dependencies left unused by this change: `seedrandom` and `semver` (only the removed v3 code used them) plus a set that was already dead, their orphaned `@types` packages, and two dead files. Adds a `knip:deps` script and a `knip.json` config so unused dependencies can be found the same way going forward. |
||
|
Matt Aitken
|
48a0b83ec6 |
feat(webapp): promo credits — /promo signup landing, redeem at plan selection, usage display (#4138)
## What & why Signup promo credits. A new logged-out `/promo?code=<code>` landing page validates the code and carries it through signup via a cookie. When the new organization is activated by selecting a plan, the code is redeemed and its credits are applied; the usage page then shows the remaining promo credits and their expiry. ## Notes - The code is redeemed at **plan selection**, not org creation: the credit grant targets the org's usage allowance, which only exists once a plan is selected — applying at creation would have nothing to grant onto. Redemption is best-effort and never blocks plan selection. - Pairs with the corresponding billing-service change (promo code validate/apply/credits + grant issuance); the two are released together. ## Testing Verified locally end to end: `/promo` shows the offer, a new account carries the code through signup, selecting the Free plan redeems it, and the usage page shows the remaining credits. 🤖 Generated with [Claude Code](https://claude.com/claude-code) |
||
|
Chris Arderne
|
34b1a181c2 | fix: security release 2026-07-06 (#4199) | ||
|
James Ritchie
|
bb450e608d |
feat(webapp): SSO & Directory Sync settings UI improvements (#4196)
📚 Publish docs / publish (push) Has been cancelled
## Summary UI/layout/copy pass over the org **SSO & Directory Sync** settings page (formerly "Identity & Access"). No logic, gates, flags, or data flow changed — server-side auth (`manage:sso`), Enterprise entitlement, action validation, and data loading are all untouched. - Renamed the nav item, page title, and meta from "Identity & Access" to "SSO & Directory Sync". - Added a reusable `SettingsLayout` component system (container, section, header, row, block, actions) modeled on `/account/security`, and refactored the SSO page onto it (section titles, dividers, left title/subtitle + right action rows). - Tightened all UI copy: concise, active voice, consistent labels, no em-dashes. - `Select` primitive: additive `wrap`, `popoverClassName`, and `placement` props (all default to prior behavior) so role options show a bright title with a wrapping description, right-aligned popover, and no horizontal overflow. - Removed the external-link arrow icon from buttons that open a modal; kept it only on genuinely external actions (Contact us, Open in new tab). - Polished the admin portal link dialog: smaller description, tighter spacing, `ClipboardField` with a permanent copy button, removed the redundant Copy link button, and a provider-aware Open label (e.g. "Open in WorkOS") derived from the link host with a safe fallback. ### SSO page UI <img width="3568" height="2550" alt="CleanShot 2026-07-08 at 18 52 11@2x" src="https://github.com/user-attachments/assets/009d2437-7552-4ff0-a457-64744a9fcd88" /> ### Login with SSO and normal email test (local) https://github.com/user-attachments/assets/b33a4ce9-c1fa-45c9-bd3c-077cb6fc9473 ## Test plan - [ ] Non-Enterprise org: SSO page shows the upsell state - [ ] Enterprise org, non-Owner without `manage:sso`: 403 - [ ] Enterprise Owner: verify domains, configure SSO, connect directory, JIT/default/group role selects, and enforcement toggle all work - [ ] Role select popovers: bright title + wrapping description, right-aligned, no horizontal scroll - [ ] Admin portal dialog: copy button works, "Open in WorkOS" opens the portal in a new tab --------- Co-authored-by: Cursor <cursoragent@cursor.com> |
||
|
Katia Bulatova
|
6e827f1da3 |
chore: Tailwind CSS v4 migration (#4139)
Migrates the webapp from Tailwind CSS 3.4 to 4.x. |
||
|
James Ritchie
|
7c5f089d3d | feat(webapp): rework login page and SSO sign-in UI (#4182) | ||
|
Chris Arderne
|
f4af13981a | feat: auto-update dev and preview branch selector (#4171) | ||
|
Daniel Sutton
|
119189f31a |
fix(webapp): accept all valid run and batch IDs in dashboard filters (#4152)
## Summary The **Run ID** and **Batch ID** filters on the runs list, batches list, and logs view rejected valid IDs. The input showed an error and the **Apply** button stayed disabled, so filtering by an affected run or batch ID from the dashboard was impossible. The filter validators hard-coded exact friendly-id character lengths. Friendly IDs come in three generations that all still exist in the data (`<prefix>_` plus a 21-char nanoid, a 25-char cuid, or a 27-char ksuid), and the hard-coded lengths never covered all three at once. ## Fix All the ID filter validators (run, batch, waitpoint, schedule) now share one helper, `makeFriendlyIdValidator` (`apps/webapp/app/utils/friendlyId.ts`), which validates by prefix plus a base62 body of any known generator length (21 / 25 / 27). The cuid and ksuid lengths are sourced from core so the helper tracks any future change to those formats. Unit tests assert it accepts the output of the real id generators and rejects malformed input. Downstream was already unaffected: run/batch route params and URL-applied filters use unconstrained validation, so only the manual filter inputs needed the fix. |
||
|
Daniel Sutton
|
618b921a51 | feat(run-ops): webapp routes — friendlyId reads, cross-seam token resolution, co-location writes (#4123) | ||
|
Daniel Sutton
|
8465ac5ac3 |
feat(run-ops): webapp db topology, flags, and split-mode resolver wiring (#4117)
## What Wires the run-ops split into the webapp: database topology, environment flags, split-mode gating, and the control-plane resolver/cache layer that the run-store and run-engine seams from the previous PR plug into. - **DB topology & env** (`apps/webapp/app/db.server.ts`, `env.server.ts`, `entry.server.tsx`): adds the run-ops database clients/topology and the environment variables that configure and gate the split. - **runOpsMigration module** (new `apps/webapp/app/v3/runOpsMigration/`): the webapp-side machinery — `splitMode.server.ts`, `controlPlaneResolver.server.ts` + `controlPlaneCache.server.ts`, `readThrough.server.ts`, `crossSeamGuard.server.ts`, `distinctDbSentinel.server.ts`, id-minting helpers (`mintBatchFriendlyId`, `runOpsMintKind`, `resolveInheritedMintKind`), `runOpsCascadeCleanup.server.ts`, the split read gate, and route/unblock catalogs. - **Store/engine wiring** (`app/v3/runStore.server.ts`, `runEngine.server.ts`, `runEngineHandlers.server.ts` + new `runEngineHandlersShared.server.ts`): points the webapp's store/engine construction at the resolver, and factors shared handler logic out so both seams use one path. - **Read-path touch-ups**: `runtimeEnvironment.server.ts`, `eventRepository/index.server.ts`, `taskRunHeartbeatFailed.server.ts`, `engineVersion.server.ts` route their run/environment lookups read-through the resolver. - `413a94511` — interlocks split mode against the native realtime backend so the two aren't enabled in an incompatible combination (see `.server-changes/run-ops-split-realtime-interlock.md`). - `dc74c57fd` — drops the earlier "known-migrated" read layer; residency is determined by id-shape only. ## Why PR5 of the run-ops split stack. This is the webapp foundation layer: it stands up the DB topology, flags, and resolver/cache the rest of the stack depends on, and repoints webapp read paths through the resolver. Additive when the split is not enabled (existing single-DB behavior preserved behind flags); behavior-changing on the read-through paths and the realtime interlock. ## Tests New vitest coverage across `apps/webapp/test/` and colocated `*.server.test.ts` files: db topology, split mode, split read gate, cross-seam guard, mint cutover / flip latency, control-plane cache, control-plane resolver, distinct-db sentinel, read-through loaders (route loaders, run-detail loaders, `findEnvironmentFromRun`), and the run-engine handlers. Testcontainers-backed; no mocks. `pnpm-lock.yaml` synced for the two new webapp deps. ## Notes Draft, **stacked on #4116** (`runops/pr04-store-engine`). Review that first; this diff is against it. Server-change / changeset note to be added at stack-assembly time. 🤖 Generated with [Claude Code](https://claude.com/claude-code) --------- Co-authored-by: Claude Opus 4.8 (1M context) <noreply@anthropic.com> |
||
|
Chris Arderne
|
86235e5cc7 | feat(webapp): add Abort button to bulk actions list rows (#4144) | ||
|
James Ritchie
|
22a7e33df7 |
fix(webapp): render error page full screen and use Enter shortcut (#4121)
Makes the app error page always render full screen — it previously inherited the width/offset of whatever container the error boundary was mounted in (e.g. the centered `max-w-xs` column in the root boundary), so `min-h-screen` alone couldn't fill the viewport. The root container now uses `fixed inset-0 z-50` to break out and cover the full screen regardless of nesting. Also changes the "Go to homepage" shortcut from `Cmd/Ctrl+G` (which collides with the browser's native "Find Again") to `Enter`. |
||
|
Matt Aitken
|
6563793132 |
fix(webapp): dashboard timezone display + preference persistence (#4104)
## Summary

Two related timezone bugs in the dashboard.

1. The date/time tooltip could show a UTC offset label that contradicted
the time it displayed. A viewer whose machine clock differs from their
saved timezone (or when a date falls in the other DST phase) would see
something like `Local (UTC +0)` next to a value that isn't at +0.
2. A user's timezone preference silently failed to save whenever their
browser reported a zone like `UTC`, `Etc/UTC`, or `Asia/Kolkata`,
leaving their timestamps stuck in a previously-saved timezone.

## Offset label

The "Local" row formatted its time using the viewer's configured
timezone but computed the `(UTC +n)` label from `new
Date().getTimezoneOffset()`, the browser's offset at the current moment.
Those are two independent sources, so they disagreed when the configured
timezone differed from the machine, and also when the displayed date was
in the opposite DST phase. The label is now derived from the same date
and timezone used to render the row (via `Intl.DateTimeFormat` with
`timeZoneName: "longOffset"`), so it always matches the displayed time.

## Preference persistence

`/resources/timezone` validated the incoming zone against
`Intl.supportedValuesOf("timeZone")`, which lists only canonical zone
ids. Browsers report zones that aren't in that list via
`resolvedOptions().timeZone`, notably `UTC` (and `Etc/UTC`,
`Asia/Kolkata`, `GMT`), so those requests returned 400 and the
preference was never stored. Validation now checks whether the runtime
can resolve the zone at all, which accepts every real zone and still
rejects invalid input.

Added unit tests for both.
|
||
|
Chris Arderne
|
e49f74e0c6 |
chore(webapp): enable dev branches for everyone (#4106)
Remove the `devBranchesEnabled` feature flag and enable behaviour by default. |
||
|
Chris Arderne
|
c7861be520 |
chore: activate no-unused-vars and import linters (#4096)
Once this is merged, oxlint is at a pretty sensible baseline. **Enable `no-unused-vars`, `typescript/consistent-type-imports`, and `import/no-duplicates` lint rules** Turns on three previously-disabled oxlint rules across the monorepo and fixes all violations: - **`no-unused-vars`** – enabled as an error with standard ignore patterns: unused function arguments are ignored by default (`args: "none"`), variables/caught errors/destructured array elements prefixed with `_` are allowed, and rest siblings are permitted. - **`typescript/consistent-type-imports`** – enforced as an error; all type-only imports now use the `import type` syntax. - **`import/no-duplicates`** – enforced as an error; duplicate import statements from the same module have been merged. The remaining commits clean up the violations found across the codebase: removing unused variables/imports/type aliases, adding `_` prefixes to intentionally unused bindings, fixing duplicate imports, and converting value imports to `import type` where appropriate. |
||
|
Chris Arderne
|
bfa902bd18 |
chore: enable more linters (#4080)
Re-enables ~15 oxlint rules that were blanket-disabled before. |
||
|
Oskar Otwinowski
|
93755cbdbd |
feat(webapp): Identity & Access setup flow improvements (#4082)
- auto-reloading for setting up identity & access - ui/ux improvements around the process of setting up connections for the identity & access |
||
|
Chris Arderne
|
1e6cc19088 |
chore(webapp): upgrade @conform-to to v1 (#4044)
## Summary Upgrades the dashboard form layer from `@conform-to` 0.9 to 1.x. No behaviour change is intended; this is the conform API migration only. conform 1.x peer-depends on `zod` `^3.21 || ^4`, so it runs on the current zod 3 and is a prerequisite for upgrading the repo to zod 4: conform 0.9 imports `ZodNativeEnum`, `ZodEffects`, and `ZodPipeline`, all removed in zod 4, so the webapp cannot build against zod 4 until conform is on 1.x. Landing this first (on zod 3) keeps the zod 4 PR focused on zod alone. ## Testing Did a bunch of local smoke tests and E2E playwright tests, several rounds of different reviewers, all clean. |
||
|
Matt Aitken
|
729ed9d107 |
feat(webapp): gate billing limits on a dedicated permission (#4073)
## Summary The billing limits page and the usage-limit banners now require a dedicated `manage:billing-limits` permission instead of the broader billing permission. This lets a role be granted control over billing limits independently of subscription and payment management. ## Details Both the loader and action of the billing limits settings page check `manage:billing-limits`. The "Configure billing limit" and "Resolve" actions in the limit banners (the no-limit-configured, grace, and rejected states) gate on the same permission. The subscription and billing pages keep using the existing billing permission. |
||
|
James Ritchie
|
9f29eb2090 |
fix(webapp): update task filter icons and the scheduled run icon (#4065)
## Summary Fixes the Tasks icon on the Runs, Logs, Errors, and metrics pages (and the task-derived queue indicators) to use the correct "T" tasks icon, and shows a clock icon for scheduled runs in the run inspector header. ## Before <img width="1440" height="704" alt="CleanShot 2026-06-28 at 21 39 57@2x" src="https://github.com/user-attachments/assets/d00d5cbf-4726-4695-825b-59f5bdd84529" /> ## After <img width="1370" height="604" alt="CleanShot 2026-06-28 at 21 38 59@2x" src="https://github.com/user-attachments/assets/fb709073-0b9f-409d-a852-72979bf14da6" /> |
||
|
James Ritchie
|
b2b4c510e2 |
feat(webapp): improve task and dashboard activity charts (#4064)
## Summary Improves and unifies the run-activity charts by extracting a shared set of chart primitives and adopting them on the three task landing pages (agent, standard, scheduled), with the density and label fixes also carried over to the dashboard and custom query charts. Main changes a reviewer should know about: - **Shared primitives (DRY).** New `ChartCard` (title + maximize/fullscreen), `ChartSyncContext` (cross-chart hover + zoom state), `useXAxisTicks` (width-aware tick selection), `activityTimeAxis`, and `statusColors`, plus a server-side `activitySeries.server.ts` holding `chooseBucketSeconds`, status grouping, and the zero-fill helpers. The three task routes and both presenters were refactored onto these, removing roughly 3x duplicated tick logic, status-color tables, and bucket-ladder code. - **Denser bars on short ranges.** Server-side bucketing now uses `chooseBucketSeconds` (nice-interval ladder, ~72 target, capped at 120 buckets) instead of the hardcoded 1h/6h/1d ladder, so a 5m or 1h range no longer collapses into a single bar. - **Width-aware x-axis labels.** Labels are selected to fit the measured plot width (always first + last, evenly spaced, de-duplicated by rendered text), stay horizontal, and reflow on panel/window resize. Y-axis values default to compact form (8K, 1.2M) in `ChartBar`/`ChartLine`. - **Synced hover line.** Hovering one of the agent page's three charts draws a dashed vertical line at the same bucket on the *other* two, and suppresses it on the hovered chart. It is opt-in via `ChartSyncProvider`, so single-chart pages are unaffected. - **Maximize button.** Each chart gets a fullscreen dialog toggle (reuses the existing dashboard-widget pattern, `v` shortcut while hovered). - **Drag-to-zoom on task pages.** Dragging across a task chart sets the Time/Date filter (`from`/`to` URL params, clearing `period`/`cursor`), with a From/To tooltip shown during the drag. - **Custom query charts.** Long categorical x labels (run IDs, task names) middle-truncate and auto-rotate only when needed, and label thinning is now width-aware for both bar and line variants. Dashboard line-chart label density is also width-aware, tuned by a `TIME_AXIS_LABEL_SPACING_PX` constant. - **Tests.** 46 new unit tests for the pure logic (bucket selection, tick spacing, time-axis formatting, zoom range, truncation). ## Intentionally unchanged - **No click/drag zoom on the dashboard or custom query charts.** Drag-to-zoom is wired up on the task landing pages only; zooming the dashboard and custom charts is deliberately deferred to a separate follow-up PR. A plain click (without a drag) on a task chart is a no-op. - **The 25 mini activity charts on the Task list (`_index`) page are untouched.** They are hand-rolled raw-Recharts sparklines kept deliberately lightweight and do not use these primitives. - **Other raw-Recharts sparklines are untouched** (the usage sparkline, errors and prompts pages). - **No ClickHouse query semantics changed** beyond the bucket-interval parameter (same filters, same FINAL / `_is_deleted` handling). - **Webapp-only.** No public package (`packages/*`) changes, so there is no changeset; the `.server-changes/` entries cover it. --- ## Testing Added 46 unit tests covering server-side bucket selection, width-aware tick spacing, time-axis formatting, zoom-range math, and categorical label truncation (`pnpm --filter webapp run test`), and `pnpm run typecheck --filter webapp` passes. Manually exercised each task landing page (agent, standard, scheduled) plus the dashboard and custom query charts, stepping the Date/Time filter through 5m, 1h, 24h, 7d, and 30d to confirm dense bars on short ranges, non-overlapping labels that reflow on resize, the synced hover line across the agent charts, the maximize button, and drag-to-zoom updating the filter. --- ## Changelog The activity charts on the task landing pages and the dashboard and custom query charts now share one set of reusable primitives. X-axis labels are width-aware so they never overlap and reflow when a panel resizes, y-axis values are abbreviated (8K, 1.2M), and short time ranges render dense bars instead of collapsing into a single bar. Hovering any agent chart mirrors a vertical line on the others, every chart gains a maximize button, and dragging across a task chart zooms the Time/Date filter. Long categorical labels such as run IDs and task names middle-truncate and auto-rotate only when needed. --- https://github.com/user-attachments/assets/6be09e38-3a0e-4947-b6e3-4839daa2fbe0 |
||
|
Katia Bulatova
|
b1987dc090 |
feat(webapp): billing limits — pause, reject, recovery, and settings UI (#3996)
## Summary Adds Billing Limits to the webapp. Customers can set a monthly spend cap. When usage crosses the limit, billable environments enter a grace period. If the limit is not resolved before grace expires, new triggers are rejected until the organization increases or removes the limit. |
||
|
Chris Arderne
|
4fde283e76 |
chore: format and lint webapp also (#4056)
#3977 added formatting and linting everywhere else. This extends it to the webapp. |
||
|
Eric Allam
|
63bbea0d96 |
feat(webapp): move the in-dashboard agent launcher into the page header (#4053)
<img width="2400" height="1794" alt="chat-ui-closed" src="https://github.com/user-attachments/assets/35016a72-c6d2-4b6a-8760-b1da5b4a166c" /> <img width="2400" height="1794" alt="chat-ui-open" src="https://github.com/user-attachments/assets/25b3df60-9aa2-40fd-a1ba-1447eeee4c52" /> ## Summary The in-dashboard agent was launched from a button pinned to the bottom-right of every page, which floated over page controls (for example the run inspector's action bar). It now opens from a compact "Chat" button on the far right of the page header, and the same button toggles to "Collapse" while the panel is open. The panel and launcher are labelled "Chat" in the UI. The launcher only renders on env-scoped pages where the agent is enabled (same feature flag gating), so it stays hidden for everyone who doesn't have it. The existing "Ask AI" support button is untouched; it stays in place until the agent is turned on by default. ## How it works `DashboardAgent` (env layout) shares the open/close state through a small context, and `NavBar` renders a launcher that self-hides whenever that context is absent. No floating overlay, and the launcher can't appear on pages where the agent can't open. |
||
|
Chris Arderne
|
df78ef96d9 |
feat: multi dev branches (#4023)
Closes this feature request: [https://triggerdev.featurebase.app/p/isolated-dev-sessions-for-multiple-local-trigger-dev-instances](https://triggerdev.featurebase.app/p/isolated-dev-sessions-for-multiple-local-trigger-dev-instances) ### Feature notes: - CLI `trigger dev` works as before - `trigger dev --branch my-branch` to create a new branch and run against it. - `trigger dev archive --branch my-branch` to archive (or in webapp). - New webapp page to manage and archive dev branches, currently feature flagged. ### Implementation details: - No changes to data model, no backfill. `isBranchableEnvironment` column is ignored for dev branches, we use `parentEnvironmentId IS NULL` instead. - `x-trigger-branch` overloaded for preview and dev branches - New `TRIGGER_DEV_BRANCH` env var available locally. `TRIGGER_PREVIEW_BRANCH` overloaded for child runs. - Lots of new glue code to sanitise the branch checks. ### Rollout - Deploy webapp/API changes (all backwards compatible) - Manual tests on some orgs - Deploy docs, release CLI, flip feature flag for webapp feature ### NB - `api.v1.projects.$projectRef.environments.ts` will return `isBranchableEnvironment: true` for all dev environments. ### Prerequisites - [x] Typecheck will not pass until we make a new release of `@trigger.dev/platform` and bump it here |
||
|
Eric Allam
|
c06005b353 |
feat(webapp,sdk): in-dashboard AI agent (#4018)
## Summary Adds an in-dashboard AI agent: a chat panel, reachable from any environment page, that answers questions about your runs, errors, tasks, and analytics, diagnoses why a run failed, charts your data, reads your connected repo's source, and answers product and how-to questions. It is gated behind the `hasDashboardAgentAccess` feature flag (global or per-org, default off), so this PR ships disabled: the launcher is hidden unless the flag is enabled. ## Design The agent runs as a standalone `chat.agent` Trigger task in its own internal package, with no access to the webapp database, Prisma, or ClickHouse. It reads the user's data over the public API, acting as the user via a short-lived delegated user-actor token minted server-side each turn (never in the browser), building on [#3997](https://github.com/triggerdotdev/trigger.dev/pull/3997). The error and analytics tools use [#4005](https://github.com/triggerdotdev/trigger.dev/pull/4005) and the TRQL query API. The first turn of a new chat streams from a warm webapp route (Head Start) while the durable agent boots in parallel. Structured answers (a run-failure diagnosis card, a live chart) render through a small typed view catalog rather than arbitrary markup. A knowledge lane forwards product and how-to questions to the support assistant. Conversation history lives in a separate Drizzle-backed store on its own Postgres schema, kept as a display read-model so it can never corrupt the agent's model context. The SDK changes add an `apiClient` option to `chat.createStartSessionAction` and `chat.headStart`, and keep the Head Start tool-approval tail intact across a custom `prepareMessages` hook so prompt caching and Head Start compose. |


